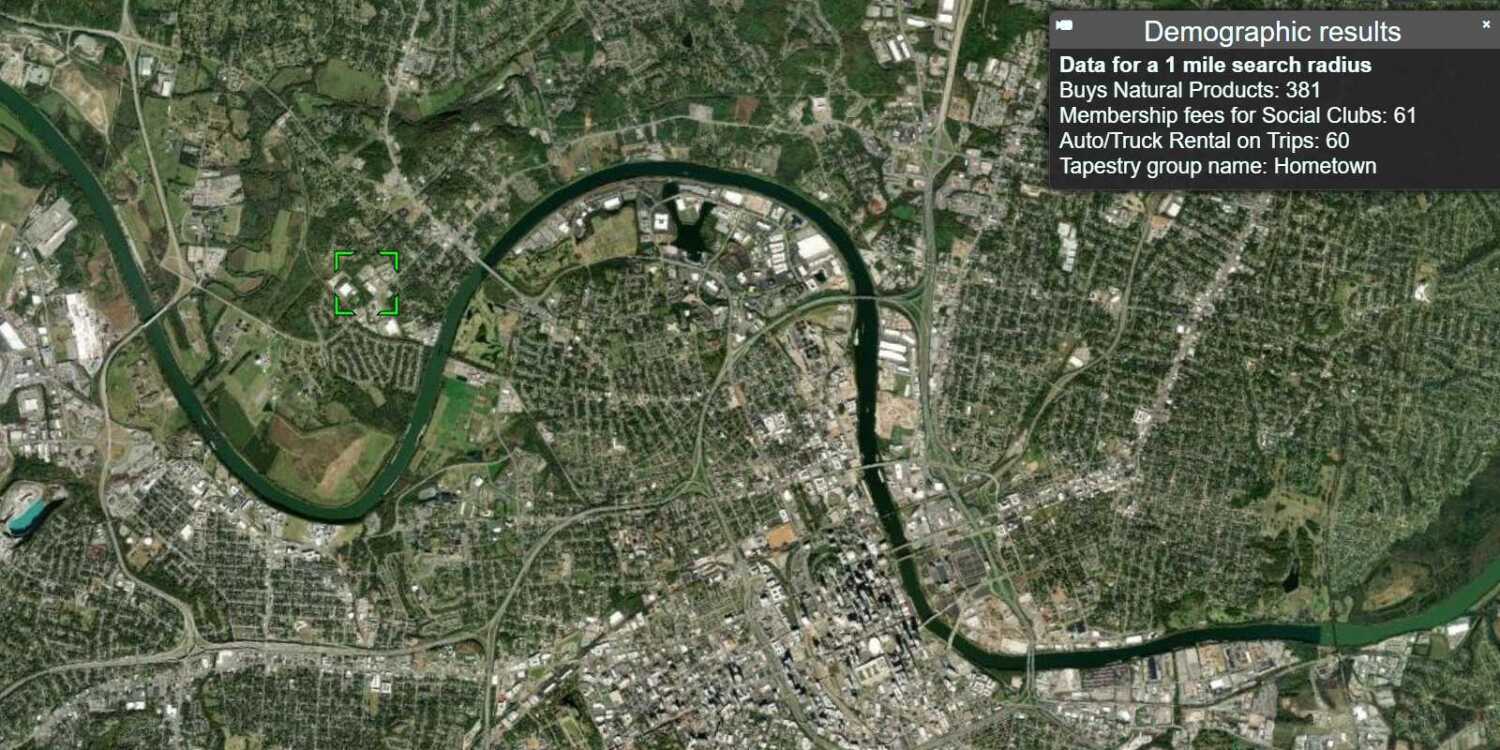
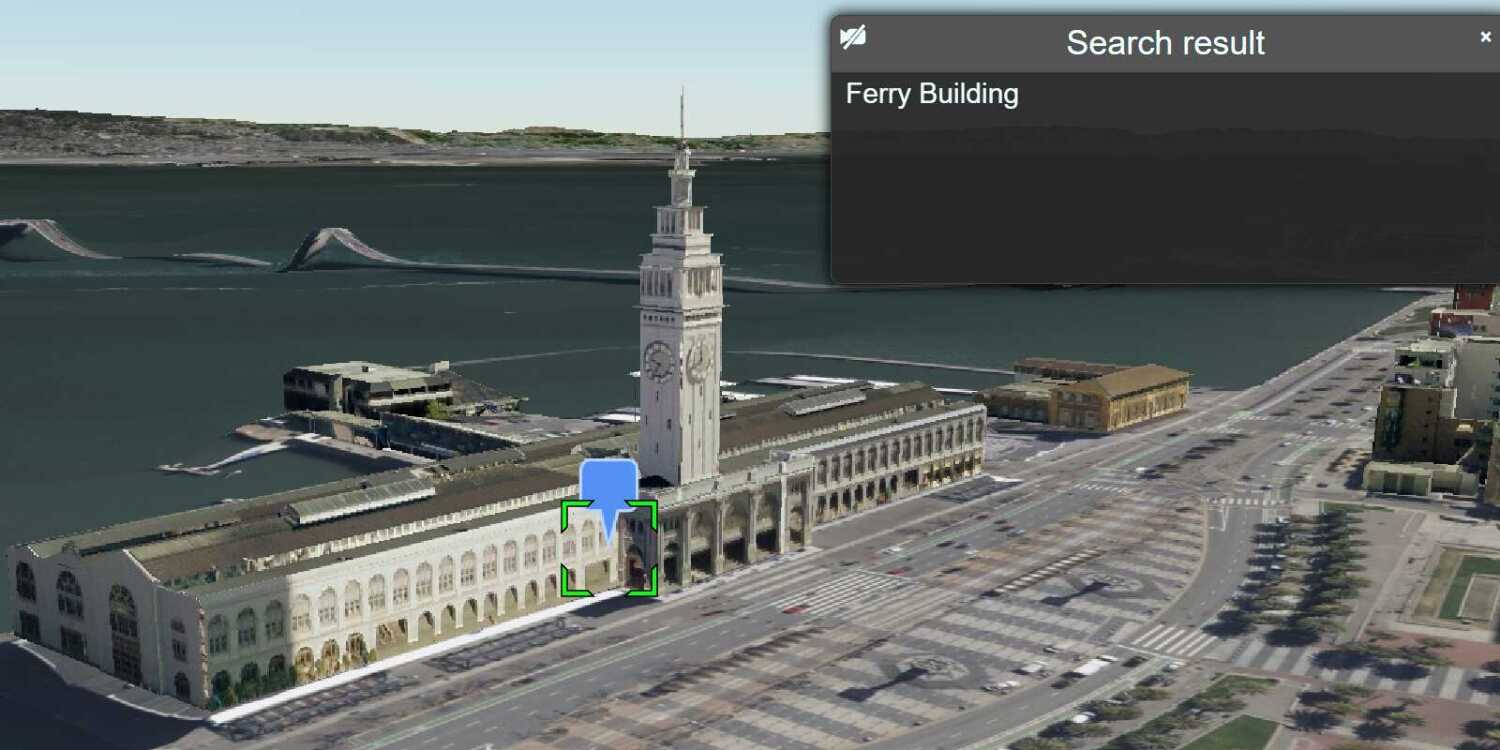
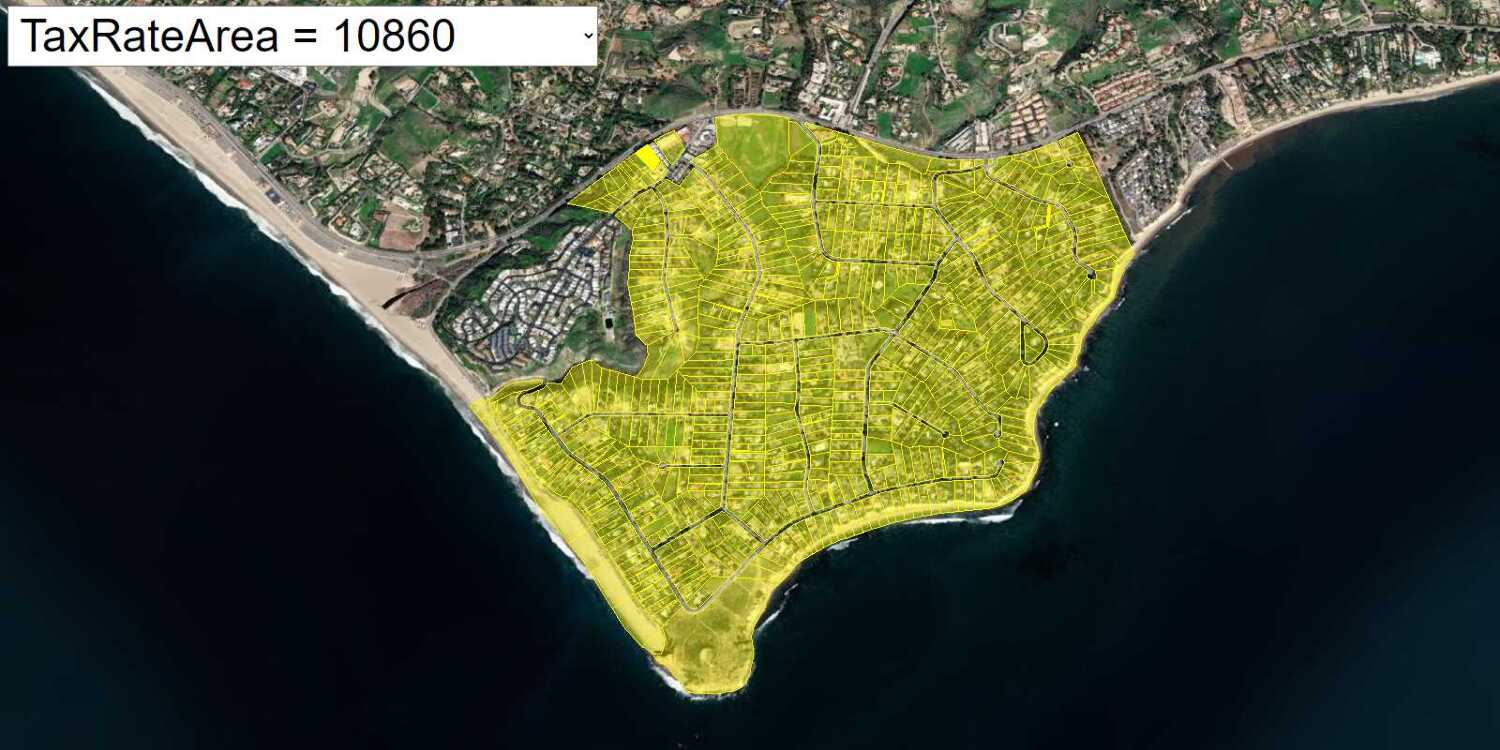
Learn how to query global demographic information for locations around the world.
The GeoEnrichment service provides global demographic data for 170 countries and regions. To get globally available information, you use the Key data collection, which returns information for the total population, total households, average household size, and total population for males and females for a study area.
In this tutorial, you use ArcGIS REST JS to access the GeoEnrichment service and display global data for Eastern Europe.
Steps
Get the starter app
Select a type of authentication below and follow the steps to create a new application.
Set up authentication
Create developer credentials in your portal for the type of authentication you selected.
Set developer credentials
Use the API key or OAuth developer credentials created in the previous step in your application.
Get a Cesium ion access token
All Cesium applications must use an access token provided through Cesium ion. This token allows you to access assets such as Cesium World Terrain in your application.
-
Go to your Cesium ion dashboard to generate an access token. Copy the key to your clipboard.
-
Create a
cesiumvariable and replaceAccess Token YOURwith the access token you copied from the Cesium ion dashboard._CESIUM _ACCESS _TOKEN Use dark colors for code blocks <script> /* Use for API key authentication */ const accessToken = "YOUR_ACCESS_TOKEN"; // or /* Use for user authentication */ // const session = await arcgisRest.ArcGISIdentityManager.beginOAuth2({ // clientId: "YOUR_CLIENT_ID", // Your client ID from OAuth credentials // redirectUri: "YOUR_REDIRECT_URI", // The redirect URL registered in your OAuth credentials // portal: "YOUR_PORTAL_URL" // Your portal URL // }) // const accessToken = session.token; Cesium.ArcGisMapService.defaultAccessToken = accessToken; const cesiumAccessToken = "YOUR_CESIUM_ACCESS_TOKEN"; </script> -
Configure
Cesium.with the Cesium access token to validate the application.Ion.default Access Token Use dark colors for code blocks <script> /* Use for API key authentication */ const accessToken = "YOUR_ACCESS_TOKEN"; // or /* Use for user authentication */ // const session = await arcgisRest.ArcGISIdentityManager.beginOAuth2({ // clientId: "YOUR_CLIENT_ID", // Your client ID from OAuth credentials // redirectUri: "YOUR_REDIRECT_URI", // The redirect URL registered in your OAuth credentials // portal: "YOUR_PORTAL_URL" // Your portal URL // }) // const accessToken = session.token; Cesium.ArcGisMapService.defaultAccessToken = accessToken; const cesiumAccessToken = "YOUR_CESIUM_ACCESS_TOKEN"; Cesium.Ion.defaultAccessToken = cesiumAccessToken; </script>
Add references to ArcGIS REST JS
-
In the
<headelement, reference the> demographicsandrequestpackages from ArcGIS REST JS.Use dark colors for code blocks <script src="https://cesium.com/downloads/cesiumjs/releases/1.125/Build/Cesium/Cesium.js"></script> <link href="https://cesium.com/downloads/cesiumjs/releases/1.125/Build/Cesium/Widgets/widgets.css" rel="stylesheet"> <script src="https://unpkg.com/@esri/arcgis-rest-request@4/dist/bundled/request.umd.js"></script> <script src="https://unpkg.com/@esri/arcgis-rest-demographics@4/dist/bundled/demographics.umd.js"></script>
Update the map position
Global data is available across many different countries and regions. Update the camera position to center on Europe.
-
Update the camera
destinationto[15.347,41.361, 3000000].Use dark colors for code blocks viewer.camera.setView({ destination : Cesium.Cartesian3.fromDegrees(15.347,41.361, 3000000), });
Add a click event handler
The study area for your application will be a one-mile buffer around a clicked location. Add an event handler that listens for left clicks on the map and retrieves their coordinates.
-
Add an event listener to the viewer's
Screenthat listens for left clicks.Space Event Handler Use dark colors for code blocks destination : Cesium.Cartesian3.fromDegrees(15.347,41.361, 3000000), }); // Add Esri attribution // Learn more in https://esriurl.com/attribution const poweredByEsri = new Cesium.Credit("Powered by <a href='https://www.esri.com/en-us/home' target='_blank'>Esri</a>", true) viewer.creditDisplay.addStaticCredit(poweredByEsri); viewer.screenSpaceEventHandler.setInputAction(function (movement) { }, Cesium.ScreenSpaceEventType.LEFT_CLICK) -
Retrieve the coordinates of the left click and convert them to
Cartographiclatitude and longitude. Pass the coordinates to a new function calledgetthat accepts coordinates as degrees.Demographics Use dark colors for code blocks destination : Cesium.Cartesian3.fromDegrees(15.347,41.361, 3000000), }); // Add Esri attribution // Learn more in https://esriurl.com/attribution const poweredByEsri = new Cesium.Credit("Powered by <a href='https://www.esri.com/en-us/home' target='_blank'>Esri</a>", true) viewer.creditDisplay.addStaticCredit(poweredByEsri); function getDemographics(longitude,latitude) { } viewer.screenSpaceEventHandler.setInputAction(function (movement) { const pickedPosition = viewer.scene.pickPosition(movement.position); const cartographic = Cesium.Cartographic.fromCartesian(pickedPosition); getDemographics(Cesium.Math.toDegrees(cartographic.longitude),Cesium.Math.toDegrees(cartographic.latitude)) }, Cesium.ScreenSpaceEventType.LEFT_CLICK)
Execute the query
Execute the query operation to retrieve local data. To query a circular buffer around a point, pass a geometry object with x and y coordinates. The default search radius is one mile.
-
Create a new
Apiusing your access token to authenticate requests to the GeoEnrichment service.Key Manager Use dark colors for code blocks /* Use for API key authentication */ const accessToken = "YOUR_ACCESS_TOKEN"; // or /* Use for user authentication */ // const session = await arcgisRest.ArcGISIdentityManager.beginOAuth2({ // clientId: "YOUR_CLIENT_ID", // Your client ID from OAuth credentials // redirectUri: "YOUR_REDIRECT_URI", // The redirect URL registered in your OAuth credentials // portal: "YOUR_PORTAL_URL" // Your portal URL // }) // const accessToken = session.token; Cesium.ArcGisMapService.defaultAccessToken = accessToken; const authentication = arcgisRest.ApiKeyManager.fromKey(accessToken); -
Access the GeoEnrichment service with
query. Set theDemographic Data studyparameter to a point geometry made from the passed longitude and latitude. Set theAreas dataparameter to toCollections ["to obtain global data for your location.Key Global Facts"] Use dark colors for code blocks function getDemographics(longitude,latitude) { arcgisRest.queryDemographicData({ studyAreas: [{geometry: {x:longitude, y:latitude}}], dataCollections: ["KeyGlobalFacts"], authentication:authentication }) }
Display results
If the query is successful, the response will contain a results array with a value containing a Feature. The Feature contains demographic information about the study area such as population, the number of males and females, and the average household size.
A message will display if there is no data available for a selected location.
-
Access the
Featurereturned by the service response. If data was returned, access the feature attributes to create a message.Set Use dark colors for code blocks arcgisRest.queryDemographicData({ studyAreas: [{geometry: {x:longitude, y:latitude}}], dataCollections: ["KeyGlobalFacts"], authentication:authentication }) .then((response) => { const featureSet = response.results[0].value.FeatureSet; let message; if (featureSet.length > 0 && featureSet[0].features.length > 0) { const attributes = featureSet[0].features[0].attributes; message = `<b>Data for a 1 mile search radius</b>` + [ `<br>Population: ${attributes.TOTPOP}`, `Males: ${attributes.TOTMALES} `, `Females: ${attributes.TOTFEMALES}`, `Average Household Size: ${attributes.AVGHHSZ}` ].join("<br>"); } else { message = "Data not available for this location."; } }) -
Create a new
Entityto display the results. Set thepositionto the clicked location, and set thedescriptionto themessageyou created.Use dark colors for code blocks else { message = "Data not available for this location."; } let resultEntity = new Cesium.Entity({ name:"Demographic results", description: message, position:Cesium.Cartesian3.fromDegrees(longitude,latitude) }); viewer.selectedEntity = resultEntity;
Run the app
Run the app.
You should now see a map centered over eastern Europe. Click on the map to query for demographic data and view the results in a popup
What's next?
Learn how to use additional ArcGIS location services in these tutorials:


