Find the elevation of a point

Learn how to find the elevation for a point in Kaneohe, Hawaii with the Elevation service.

Find the elevation for a point using API key authentication

The Elevation service is a location service that returns elevation values for a single location or multiple locations. Elevation coverage is provided for both topography (land elevations) and bathymetry (water depths) and takes location inputs as longitude and latitude coordinates.

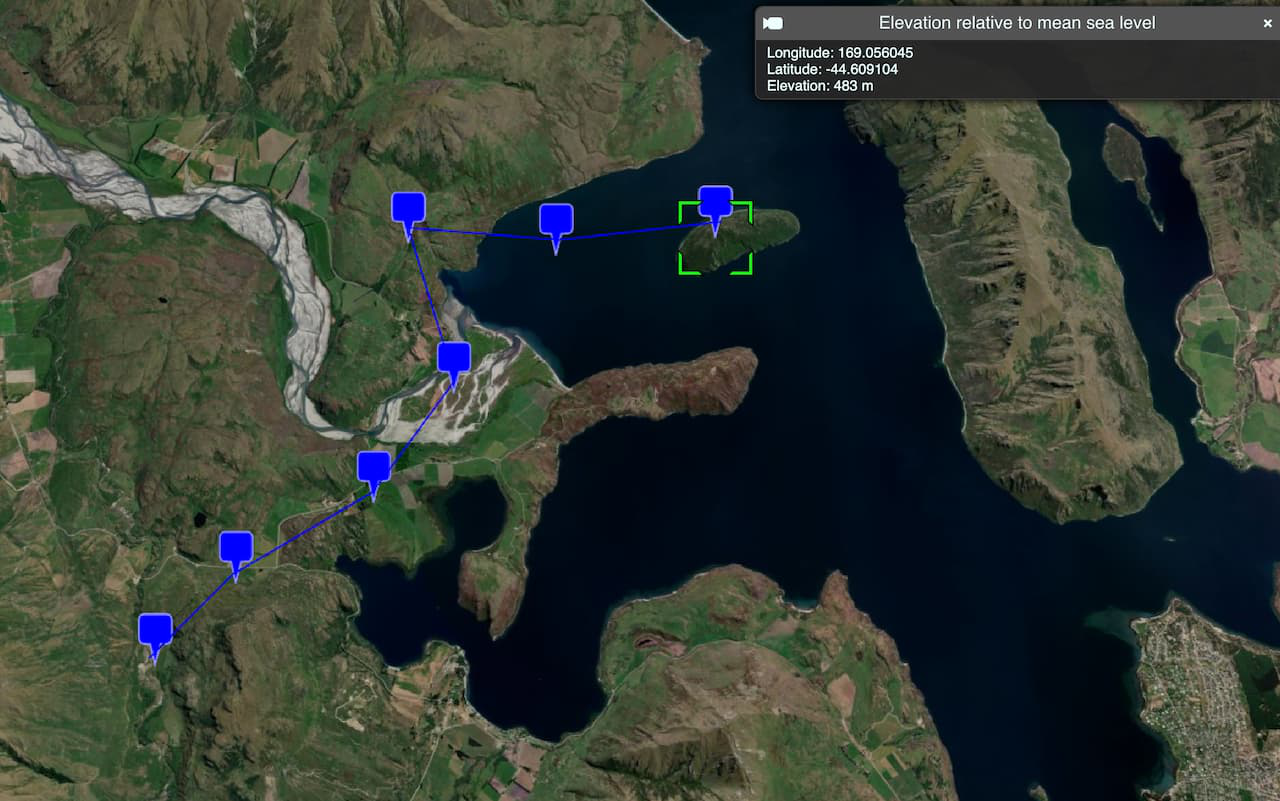
In this tutorial, you call the Elevation service to display the elevation of a single location on a map. You can toggle between viewing elevation values relative to mean sea level or above ground level.

Prerequisites

Steps

Get the starter app

Select a type of authentication below and follow the steps to create a new application.

You can choose one of the following to create a new CodePen:

  • Option 1: Complete the Display a scene tutorial; or,
  • Option 2: Start from the Display a scene tutorial .

Set up authentication

Create developer credentials in your portal for the type of authentication you selected.

Create a new API key credential with the correct privileges to access the resources used in this tutorial.

  1. Go to the Create an API key tutorial and create an API key with the following privilege(s):
    • Privileges
      • Location services > Basemaps
      • Location services > Elevation service
  2. Copy the API key access token to your clipboard when prompted.

Set developer credentials

Use the API key or OAuth developer credentials created in the previous step in your application.

  1. Add <script> elements in the HTML <body> and create an accessToken variable to store your access token. Set YOUR_ACCESS_TOKEN with the access token you previously copied from your API key credentials.

    Expand
    Use dark colors for code blocks
    1
    2
    3
    4
    5
    6
    7
    8
    9
    10
    11
    12
    13
    14
    15
    16
    17
    18
    19
    20
    21
    22
    23
    24
    25
    26
    27
    28
    29
    30
    31
    32
    33
    34
    35
    36
    37
    38
    39
    40
    41
    42
    43
    44
    45
    46
    47
    48
    49
    50
    51
    52
    53
    54
    55
    56
    57
    58
    59
    60
    61
    62
    63
    64
    65
    66
    67
    68
    69
    70
    71
    72
    73
    74
    75
    76
    77
    78
    79
    80
    81
    82
      <script>
    
        /* Use for API key authentication */
        const accessToken = "YOUR_ACCESS_TOKEN";
    
      </script>
    
    Expand
  2. Set the defaultAccessToken included with Cesium to authenticate requests to the ArcGIS services used in this tutorial.

    Expand
    Use dark colors for code blocks
    1
    2
    3
    4
    5
    6
    7
    8
    9
    10
    11
    12
    13
    14
    15
    16
    17
    18
    19
    20
    21
    22
    23
    24
    25
    26
    27
    28
    29
    30
    31
    32
    33
    34
    35
    36
    37
    38
    39
    40
    41
    42
    43
    44
    45
    46
    47
    48
    49
    50
    51
    52
    53
    54
    55
    56
    57
    58
    59
    60
    61
    62
    63
    64
    65
    66
    67
    68
    69
    70
    71
    72
    73
    74
    75
    76
    77
    78
    79
    80
    81
    82
      <script>
    
        /* Use for API key authentication */
        const accessToken = "YOUR_ACCESS_TOKEN";
    
        Cesium.ArcGisMapService.defaultAccessToken = accessToken;
    
      </script>
    
    Expand

Add script references

Reference the ArcGIS REST JS request and elevation packages to access the Elevation service. You also reference the Calcite Design System library to create the user interface.

  1. Reference the request and elevation packages from ArcGIS REST JS.

    Use dark colors for code blocks
    1
    2
    3
    4
    5
    6
    7
    8
    9
    10
    11
    12
    13
    14
    15
    16
    17
    18
    19
    20
    21
    22
    23
    24
    25
    26
    27
    28
    29
    30
    31
    32
    33
    34
    35
    36
    37
    38
    39
    40
    41
    42
    43
    44
    45
    46
    47
    48
    49
    50
    51
    52
    53
    54
    55
    56
    57
    58
    59
    60
    61
    62
    63
    64
    65
    66
    67
    68
    69
    70
    71
    72
    73
    74
    75
    76
    77
    78
    79
    80
    81
    82
    83
    84
    85
    86
    87
    88
    89
    90
    91
    92
    93
    94
    95
    96
    97
    98
    99
    100
    101
    102
    103
    104
    105
    106
    107
    108
    109
    110
    111
    112
    113
    114
    115
    116
    117
    118
    119
    120
    121
    122
    123
    124
    125
    126
    127
    128
    129
    130
    131
    132
      <script src="https://cesium.com/downloads/cesiumjs/releases/1.125/Build/Cesium/Cesium.js"></script>
      <link href="https://cesium.com/downloads/cesiumjs/releases/1.125/Build/Cesium/Widgets/widgets.css" rel="stylesheet">
    
      <!--  ArcGIS REST JS  -->
      <script src="https://unpkg.com/@esri/arcgis-rest-request@4/dist/bundled/request.umd.js"></script>
      <script src="https://unpkg.com/@esri/arcgis-rest-elevation@1/dist/bundled/elevation.umd.js"></script>
    
  2. Reference the Calcite Design System library.

    Use dark colors for code blocks
    1
    2
    3
    4
    5
    6
    7
    8
    9
    10
    11
    12
    13
    14
    15
    16
    17
    18
    19
    20
    21
    22
    23
    24
    25
    26
    27
    28
    29
    30
    31
    32
    33
    34
    35
    36
    37
    38
    39
    40
    41
    42
    43
    44
    45
    46
    47
    48
    49
    50
    51
    52
    53
    54
    55
    56
    57
    58
    59
    60
    61
    62
    63
    64
    65
    66
    67
    68
    69
    70
    71
    72
    73
    74
    75
    76
    77
    78
    79
    80
    81
    82
    83
    84
    85
    86
    87
    88
    89
    90
    91
    92
    93
    94
    95
    96
    97
    98
    99
    100
    101
    102
    103
    104
    105
    106
    107
    108
    109
    110
    111
    112
    113
    114
    115
    116
    117
    118
    119
    120
    121
    122
    123
    124
    125
    126
    127
    128
    129
    130
    131
    132
      <script src="https://cesium.com/downloads/cesiumjs/releases/1.125/Build/Cesium/Cesium.js"></script>
      <link href="https://cesium.com/downloads/cesiumjs/releases/1.125/Build/Cesium/Widgets/widgets.css" rel="stylesheet">
    
      <!-- Calcite -->
      <script type="module" src="https://js.arcgis.com/calcite-components/2.12.1/calcite.esm.js"></script>
      <link rel="stylesheet" type="text/css" href="https://js.arcgis.com/calcite-components/2.12.1/calcite.css" />
    
      <!--  ArcGIS REST JS  -->
      <script src="https://unpkg.com/@esri/arcgis-rest-request@4/dist/bundled/request.umd.js"></script>
      <script src="https://unpkg.com/@esri/arcgis-rest-elevation@1/dist/bundled/elevation.umd.js"></script>
    

Update the map

In this step, you update the map by setting the viewpoint to focus on Kaneohe, Hawaii.

  1. To focus on Kaneohe, Hawaii, update the map's viewpoint to -157.750, 21.380 and set the scale to 18055.
    Expand
    Use dark colors for code blocks
    1
    2
    3
    4
    5
    6
    7
    8
    9
    10
    11
    12
    13
    14
    15
    16
    17
    18
    19
    20
    21
    22
    23
    24
    25
    26
    27
    28
    29
    30
    31
    32
    33
    34
    35
    36
    37
    38
    39
    40
    41
    42
    43
    44
    45
    46
    47
    48
    49
    50
    51
    52
    53
    54
    55
    56
    57
    58
    59
    60
    61
    62
    63
    64
    65
    66
    67
    68
    69
    70
    71
    72
    73
    74
    75
    76
    77
    78
    79
    80
    81
    82
    83
    84
    85
    86
    87
    88
    89
    90
    91
    92
    93
    94
    95
    96
    97
    98
    99
    100
    101
    102
    103
    104
    105
    106
    107
    108
    109
    110
    111
    112
    113
    114
    115
    116
    117
    118
    119
    120
    121
    122
    123
    124
    125
    126
    127
    128
    129
    130
    131
    132
        viewer.camera.setView({
          destination: Cesium.Cartesian3.fromDegrees(-157.750, 21.380, 18055),
          orientation: {
            heading: Cesium.Math.toRadians(0.0),
            pitch: Cesium.Math.toRadians(-80.0)
          }
        });
    
    Expand

Get elevation data

In this step, you use the Elevation service to retrieve elevation data based on the clicked point on the map.

  1. Create a variable called elevationMeasure to store the default elevation reference (datum), which will be meanSeaLevel and add an event listener to your toggle to update the elevationMeasure accordingly.

    Expand
    Use dark colors for code blocks
    1
    2
    3
    4
    5
    6
    7
    8
    9
    10
    11
    12
    13
    14
    15
    16
    17
    18
    19
    20
    21
    22
    23
    24
    25
    26
    27
    28
    29
    30
    31
    32
    33
    34
    35
    36
    37
    38
    39
    40
    41
    42
    43
    44
    45
    46
    47
    48
    49
    50
    51
    52
    53
    54
    55
    56
    57
    58
    59
    60
    61
    62
    63
    64
    65
    66
    67
    68
    69
    70
    71
    72
    73
    74
    75
    76
    77
    78
    79
    80
    81
    82
    83
    84
    85
    86
    87
    88
    89
    90
    91
    92
    93
    94
    95
    96
    97
    98
    99
    100
    101
    102
    103
    104
    105
    106
    107
    108
    109
    110
    111
    112
    113
    114
    115
    116
    117
    118
    119
    120
    121
    122
    123
    124
    125
    126
    127
    128
    129
    130
    131
    132
        /* Use for API key authentication */
        const accessToken = "YOUR_ACCESS_TOKEN";
    
        // or
    
        /* Use for user authentication */
        // const session = await arcgisRest.ArcGISIdentityManager.beginOAuth2({
        //   clientId: "YOUR_CLIENT_ID", // Your client ID from OAuth credentials
        //   redirectUri: "YOUR_REDIRECT_URI", // The redirect URL registered in your OAuth credentials
        //   portal: "YOUR_PORTAL_URL" // Your portal URL
        // })
    
        // const accessToken = session.token;
    
        Cesium.ArcGisMapService.defaultAccessToken = accessToken;
    
        const cesiumAccessToken = "YOUR_CESIUM_ACCESS_TOKEN";
    
        Cesium.Ion.defaultAccessToken = cesiumAccessToken;
    
        const viewer = new Cesium.Viewer("cesiumContainer", {
          terrain: Cesium.Terrain.fromWorldTerrain(),
          timeline: false,
          animation: false,
          geocoder: false,
        });
    
        viewer.camera.setView({
          destination: Cesium.Cartesian3.fromDegrees(-157.750, 21.380, 18055),
          orientation: {
            heading: Cesium.Math.toRadians(0.0),
            pitch: Cesium.Math.toRadians(-80.0)
          }
        });
    
        let elevationMeasure = "meanSeaLevel";
    
        document.getElementById("elevationControl").addEventListener("calciteSwitchChange", async (event) => {
          elevationMeasure = event.target.checked ? "meanSeaLevel" : "ellipsoid";
        });
    
        // Add Esri attribution
        const poweredByEsri = new Cesium.Credit("Powered by <a href='https://www.esri.com/en-us/home' target='_blank'>Esri</a>", true);
        viewer.creditDisplay.addStaticCredit(poweredByEsri);
    
    Expand
  2. Create a function called getElevationData that takes longitude and latitude as parameters.

    Expand
    Use dark colors for code blocks
    1
    2
    3
    4
    5
    6
    7
    8
    9
    10
    11
    12
    13
    14
    15
    16
    17
    18
    19
    20
    21
    22
    23
    24
    25
    26
    27
    28
    29
    30
    31
    32
    33
    34
    35
    36
    37
    38
    39
    40
    41
    42
    43
    44
    45
    46
    47
    48
    49
    50
    51
    52
    53
    54
    55
    56
    57
    58
    59
    60
    61
    62
    63
    64
    65
    66
    67
    68
    69
    70
    71
    72
    73
    74
    75
    76
    77
    78
    79
    80
    81
    82
    83
    84
    85
    86
    87
    88
    89
    90
    91
    92
    93
    94
    95
    96
    97
    98
    99
    100
    101
    102
    103
    104
    105
    106
    107
    108
    109
    110
    111
    112
    113
    114
    115
    116
    117
    118
    119
    120
    121
    122
    123
    124
    125
    126
    127
    128
    129
    130
    131
    132
        async function getElevationData(lon, lat) {
    
        }
    
    Expand
  3. Make a request to the Elevation service, passing in the array of points.

    Expand
    Use dark colors for code blocks
    1
    2
    3
    4
    5
    6
    7
    8
    9
    10
    11
    12
    13
    14
    15
    16
    17
    18
    19
    20
    21
    22
    23
    24
    25
    26
    27
    28
    29
    30
    31
    32
    33
    34
    35
    36
    37
    38
    39
    40
    41
    42
    43
    44
    45
    46
    47
    48
    49
    50
    51
    52
    53
    54
    55
    56
    57
    58
    59
    60
    61
    62
    63
    64
    65
    66
    67
    68
    69
    70
    71
    72
    73
    74
    75
    76
    77
    78
    79
    80
    81
    82
    83
    84
    85
    86
    87
    88
    89
    90
    91
    92
    93
    94
    95
    96
    97
    98
    99
    100
    101
    102
    103
    104
    105
    106
    107
    108
    109
    110
    111
    112
    113
    114
    115
    116
    117
    118
    119
    120
    121
    122
    123
    124
    125
    126
    127
    128
    129
    130
    131
    132
        async function getElevationData(lon, lat) {
    
          const response = await arcgisRest.findElevationAtPoint({
            lon: lon,
            lat: lat,
            relativeTo: elevationMeasure,
            authentication: arcgisRest.ApiKeyManager.fromKey(accessToken)
          })
    
        }
    
    Expand
  4. Add a click event handler on the map that calls the function and passes the selected point on the map as a parameter.

    Expand
    Use dark colors for code blocks
    1
    2
    3
    4
    5
    6
    7
    8
    9
    10
    11
    12
    13
    14
    15
    16
    17
    18
    19
    20
    21
    22
    23
    24
    25
    26
    27
    28
    29
    30
    31
    32
    33
    34
    35
    36
    37
    38
    39
    40
    41
    42
    43
    44
    45
    46
    47
    48
    49
    50
    51
    52
    53
    54
    55
    56
    57
    58
    59
    60
    61
    62
    63
    64
    65
    66
    67
    68
    69
    70
    71
    72
    73
    74
    75
    76
    77
    78
    79
    80
    81
    82
    83
    84
    85
    86
    87
    88
    89
    90
    91
    92
    93
    94
    95
    96
    97
    98
    99
    100
    101
    102
    103
    104
    105
    106
    107
    108
    109
    110
    111
    112
    113
    114
    115
    116
    117
    118
    119
    120
    121
    122
    123
    124
    125
    126
    127
    128
    129
    130
    131
    132
        viewer.screenSpaceEventHandler.setInputAction(function (movement) {
          const pickedPosition = viewer.scene.pickPosition(movement.position);
          const cartographic = Cesium.Cartographic.fromCartesian(pickedPosition);
          getElevationData(Cesium.Math.toDegrees(cartographic.longitude), Cesium.Math.toDegrees(cartographic.latitude))
        }, Cesium.ScreenSpaceEventType.LEFT_CLICK)
    
    Expand

Display results

In this step, you extract the elevation data from the response and display it in a popup on the map.

  1. Extract the x, y, and z values from the elevation request response.

    Expand
    Use dark colors for code blocks
    1
    2
    3
    4
    5
    6
    7
    8
    9
    10
    11
    12
    13
    14
    15
    16
    17
    18
    19
    20
    21
    22
    23
    24
    25
    26
    27
    28
    29
    30
    31
    32
    33
    34
    35
    36
    37
    38
    39
    40
    41
    42
    43
    44
    45
    46
    47
    48
    49
    50
    51
    52
    53
    54
    55
    56
    57
    58
    59
    60
    61
    62
    63
    64
    65
    66
    67
    68
    69
    70
    71
    72
    73
    74
    75
    76
    77
    78
    79
    80
    81
    82
    83
    84
    85
    86
    87
    88
    89
    90
    91
    92
    93
    94
    95
    96
    97
    98
    99
    100
    101
    102
    103
    104
    105
    106
    107
    108
    109
    110
    111
    112
    113
    114
    115
    116
    117
    118
    119
    120
    121
    122
    123
    124
    125
    126
    127
    128
    129
    130
    131
    132
        async function getElevationData(lon, lat) {
    
          const response = await arcgisRest.findElevationAtPoint({
            lon: lon,
            lat: lat,
            relativeTo: elevationMeasure,
            authentication: arcgisRest.ApiKeyManager.fromKey(accessToken)
          })
    
          const { x, y, z } = response.result.point;
    
        }
    
    Expand
  2. Use Entity() to show the elevation (z value) at the clicked location in a popup format.

    Expand
    Use dark colors for code blocks
    1
    2
    3
    4
    5
    6
    7
    8
    9
    10
    11
    12
    13
    14
    15
    16
    17
    18
    19
    20
    21
    22
    23
    24
    25
    26
    27
    28
    29
    30
    31
    32
    33
    34
    35
    36
    37
    38
    39
    40
    41
    42
    43
    44
    45
    46
    47
    48
    49
    50
    51
    52
    53
    54
    55
    56
    57
    58
    59
    60
    61
    62
    63
    64
    65
    66
    67
    68
    69
    70
    71
    72
    73
    74
    75
    76
    77
    78
    79
    80
    81
    82
    83
    84
    85
    86
    87
    88
    89
    90
    91
    92
    93
    94
    95
    96
    97
    98
    99
    100
    101
    102
    103
    104
    105
    106
    107
    108
    109
    110
    111
    112
    113
    114
    115
    116
    117
    118
    119
    120
    121
    122
    123
    124
    125
    126
    127
    128
    129
    130
    131
    132
        async function getElevationData(lon, lat) {
    
          const response = await arcgisRest.findElevationAtPoint({
            lon: lon,
            lat: lat,
            relativeTo: elevationMeasure,
            authentication: arcgisRest.ApiKeyManager.fromKey(accessToken)
          })
    
          const { x, y, z } = response.result.point;
    
          let elevationInfo = `<b>Elevation relative to ${elevationMeasure === "meanSeaLevel" ? "mean sea level" : "ground level"}</b><br>Latitude: ${y.toFixed(5)}<br>Longitude: ${x.toFixed(5)}<br>Elevation: ${z} m`
    
          let resultEntity = new Cesium.Entity({
            name: "Elevation results",
            description: elevationInfo,
            position: Cesium.Cartesian3.fromDegrees(lon, lat)
          });
    
          viewer.selectedEntity = resultEntity;
    
        }
    
    Expand

Run the app

Run the app.

You should now see a map centered over Kaneohe, Hawaii. Click on the map to access the Elevation service to return elevation information and view the results in a popup.

What's next?

Learn how to use additional ArcGIS location services in these tutorials:

Your browser is no longer supported. Please upgrade your browser for the best experience. See our browser deprecation post for more details.