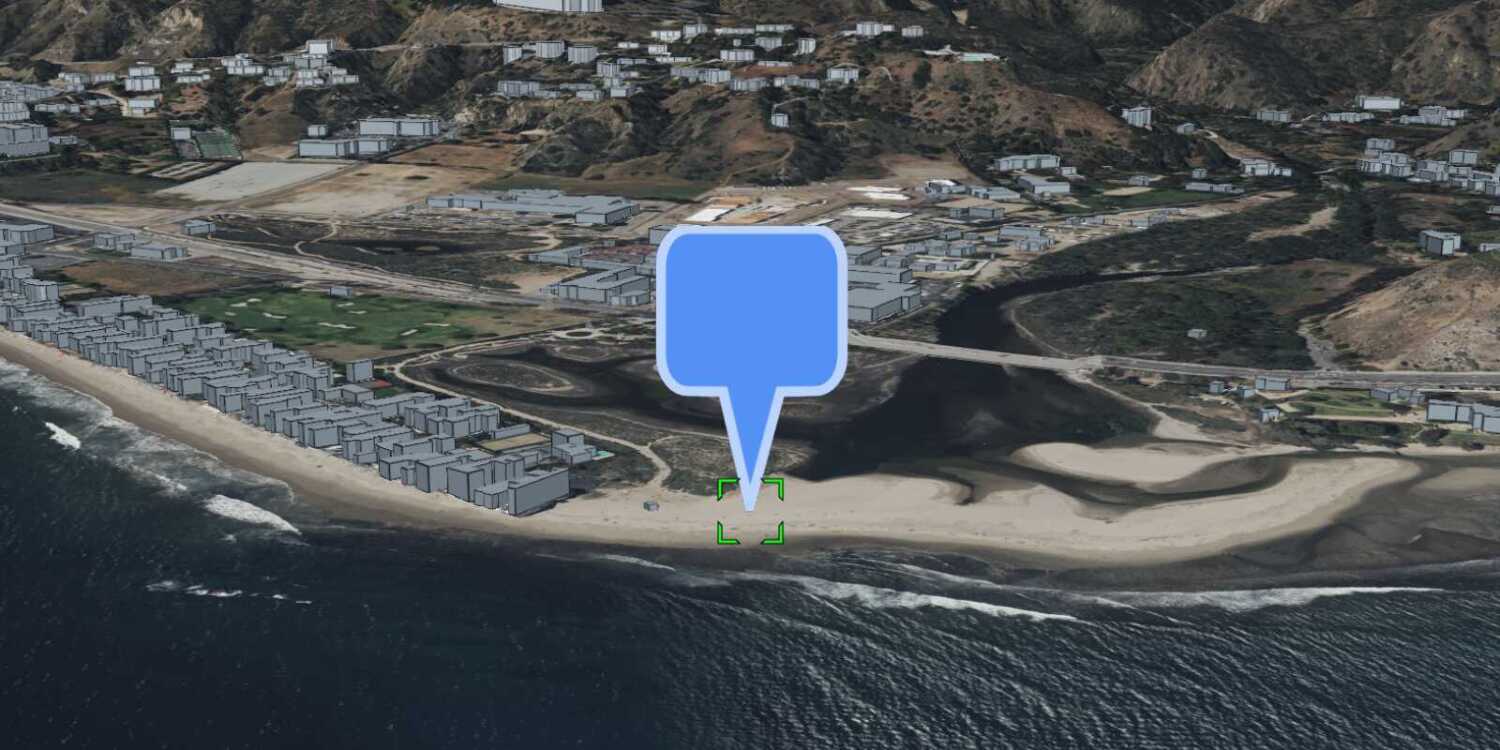
Learn how to use data-driven styling to apply symbol colors and styles to feature layers.
A feature layer is a dataset in a feature service hosted in ArcGIS. Each feature layer contains features with a single geometry type (point, line, or polygon), and a set of attributes.
In this tutorial, you apply different styles to enhance the visualization of the Trailheads, Trails, and Parks and Open Spaces feature layers.
Prerequisites
An ArcGIS Location Platform or ArcGIS Online account.
Steps
Get the starter app
Select a type of authentication below and follow the steps to create a new application.
Set up authentication
Create developer credentials in your portal for the type of authentication you selected.
Set developer credentials
Use the API key or OAuth developer credentials created in the previous step in your application.
Get a Cesium ion access token
All Cesium applications must use an access token provided through Cesium ion. This token allows you to access assets such as Cesium World Terrain in your application.
-
Go to your Cesium ion dashboard to generate an access token. Copy the key to your clipboard.
-
Create a
cesiumvariable and replaceAccess Token YOURwith the access token you copied from the Cesium ion dashboard._CESIUM _ACCESS _TOKEN Use dark colors for code blocks <script> /* Use for API key authentication */ const accessToken = "YOUR_ACCESS_TOKEN"; // or /* Use for user authentication */ // const session = await arcgisRest.ArcGISIdentityManager.beginOAuth2({ // clientId: "YOUR_CLIENT_ID", // Your client ID from OAuth credentials // redirectUri: "YOUR_REDIRECT_URI", // The redirect URL registered in your OAuth credentials // portal: "YOUR_PORTAL_URL" // Your portal URL // }) // const accessToken = session.token; Cesium.ArcGisMapService.defaultAccessToken = accessToken; const cesiumAccessToken = "YOUR_CESIUM_ACCESS_TOKEN"; </script> -
Configure
Cesium.with the Cesium access token to validate the application.Ion.default Access Token Use dark colors for code blocks <script> /* Use for API key authentication */ const accessToken = "YOUR_ACCESS_TOKEN"; // or /* Use for user authentication */ // const session = await arcgisRest.ArcGISIdentityManager.beginOAuth2({ // clientId: "YOUR_CLIENT_ID", // Your client ID from OAuth credentials // redirectUri: "YOUR_REDIRECT_URI", // The redirect URL registered in your OAuth credentials // portal: "YOUR_PORTAL_URL" // Your portal URL // }) // const accessToken = session.token; Cesium.ArcGisMapService.defaultAccessToken = accessToken; const cesiumAccessToken = "YOUR_CESIUM_ACCESS_TOKEN"; Cesium.Ion.defaultAccessToken = cesiumAccessToken; </script>
Add references to ArcGIS REST JS
-
In the
<headelement, reference the> feature-serviceandrequestpackages from ArcGIS REST JS.Use dark colors for code blocks <script src="https://cesium.com/downloads/cesiumjs/releases/1.125/Build/Cesium/Cesium.js"></script> <link href="https://cesium.com/downloads/cesiumjs/releases/1.125/Build/Cesium/Widgets/widgets.css" rel="stylesheet"> <script src="https://unpkg.com/@esri/arcgis-rest-request@4/dist/bundled/request.umd.js"></script> <script src="https://unpkg.com/@esri/arcgis-rest-feature-service@4/dist/bundled/feature-service.umd.js"></script> -
In the
<body, create an> arcgisusing your access token to authenticate requests to the feature service.Rest. Api Key Manager Use dark colors for code blocks /* Use for API key authentication */ const accessToken = "YOUR_ACCESS_TOKEN"; // or /* Use for user authentication */ // const session = await arcgisRest.ArcGISIdentityManager.beginOAuth2({ // clientId: "YOUR_CLIENT_ID", // Your client ID from OAuth credentials // redirectUri: "YOUR_REDIRECT_URI", // The redirect URL registered in your OAuth credentials // portal: "YOUR_PORTAL_URL" // Your portal URL // }) // const accessToken = session.token; Cesium.ArcGisMapService.defaultAccessToken = accessToken; const authentication = arcgisRest.ApiKeyManager.fromKey(accessToken);
Remove the terrain provider
CesiumJS does not currently fully support layer styling in scenes with terrain.
-
Remove the
terrainfrom your viewer to enable layer ordering and feature outlines.Provider Use dark colors for code blocks const viewer = new Cesium.Viewer("cesiumContainer", { imageryProvider: arcGISImageTileProvider, terrainProvider: Cesium.createWorldTerrain(), timeline: false, animation: false, geocoder:false });
Style trailheads (points) with icons
To style a point feature layer with custom icons, add the layer as a Geo and iterate through each Entity created by the layer. Set the Billboard property to style the points with trailhead icons.
-
Use
arcgisto make an authenticated request to the Trailheads URL. Format the response as GeoJSON, then add it to your scene as aRest.query Features Geo.Json Data Source Use dark colors for code blocks const pointLayerURL = "https://services3.arcgis.com/GVgbJbqm8hXASVYi/arcgis/rest/services/Trailheads/FeatureServer/0"; arcgisRest.queryFeatures({ url: pointLayerURL, authentication, f:"geojson" }).then((response) => { Cesium.GeoJsonDataSource.load(response,{ clampToGround:true, }).then((dataSource) => { dataSource.name="trailheads"; viewer.dataSources.add(dataSource); }) }) -
Add the data attribution for the feature layer source.
- Go to the Trailheads (Santa Monica Mountains) item.
- Scroll down to the Credits (Attribution) section and copy its value.
- Create an
attributionproperty and paste the attribution value from the item.Use dark colors for code blocks const pointLayerURL = "https://services3.arcgis.com/GVgbJbqm8hXASVYi/arcgis/rest/services/Trailheads/FeatureServer/0"; arcgisRest.queryFeatures({ url: pointLayerURL, authentication, f:"geojson" }).then((response) => { Cesium.GeoJsonDataSource.load(response,{ clampToGround:true, // Attribution text retrieved from https://arcgis.com/home/item.html?id=883cedb8c9fe4524b64d47666ed234a7 credit: "Los Angeles GeoHub" }).then((dataSource) => { dataSource.name="trailheads"; viewer.dataSources.add(dataSource); }) })
-
After the layer is loaded, iterate through each
Entityin the layer and set eachBillboardimage to the URL for the hiker icon:http.://static.arcgis.com/images/ Symbols/ NP S/nps Pictograph _0231b.png Use dark colors for code blocks const pointLayerURL = "https://services3.arcgis.com/GVgbJbqm8hXASVYi/arcgis/rest/services/Trailheads/FeatureServer/0"; arcgisRest.queryFeatures({ url: pointLayerURL, authentication, f:"geojson" }).then((response) => { Cesium.GeoJsonDataSource.load(response,{ clampToGround:true, // Attribution text retrieved from https://arcgis.com/home/item.html?id=883cedb8c9fe4524b64d47666ed234a7 credit: "Los Angeles GeoHub" }).then((dataSource) => { dataSource.name="trailheads"; viewer.dataSources.add(dataSource); const entities = dataSource.entities.values; for (let i=0; i<entities.length;i++) { entities[i].billboard.image = "http://static.arcgis.com/images/Symbols/NPS/npsPictograph_0231b.png" entities[i].billboard.scale=0.4; } }) })
Style trails (lines) by elevation gain
To visualize the elevation gain of trails in the Trails (lines) feature layer, add the layer as a Geo and the width of each line based on its properties.
-
Call the
arcgisoperation to make an authenticated request to the Trails URL. Format the response as GeoJSON and add it to the scene as aRest.query Features Geo.Json Data Source Use dark colors for code blocks const lineLayerURL = "https://services3.arcgis.com/GVgbJbqm8hXASVYi/arcgis/rest/services/Trails/FeatureServer/0"; arcgisRest.queryFeatures({ url: lineLayerURL, authentication, f:"geojson" }).then((response) => { Cesium.GeoJsonDataSource.load(response,{ clampToGround:true, }).then((dataSource) => { dataSource.name="trails"; viewer.dataSources.add(dataSource); }) }) -
Add the data attribution for the feature layer source.
- Go to the Trails item.
- Scroll down to the Credits (Attribution) section and copy its value.
- Create an
attributionproperty and paste the attribution value from the item.Use dark colors for code blocks const lineLayerURL = "https://services3.arcgis.com/GVgbJbqm8hXASVYi/arcgis/rest/services/Trails/FeatureServer/0"; arcgisRest.queryFeatures({ url: lineLayerURL, authentication, f:"geojson" }).then((response) => { Cesium.GeoJsonDataSource.load(response,{ clampToGround:true, // Attribution text retrieved from https://arcgis.com/home/item.html?id=69e12682738e467eb509d8b54dc73cbd credit: "Los Angeles GeoHub" }).then((dataSource) => { dataSource.name="trails"; viewer.dataSources.add(dataSource); }) })
-
Iterate through all entities and set the
polylinewidth of each entity based on theirELEVproperty._GAIN Use dark colors for code blocks const lineLayerURL = "https://services3.arcgis.com/GVgbJbqm8hXASVYi/arcgis/rest/services/Trails/FeatureServer/0"; arcgisRest.queryFeatures({ url: lineLayerURL, authentication, f:"geojson" }).then((response) => { Cesium.GeoJsonDataSource.load(response,{ clampToGround:true, // Attribution text retrieved from https://arcgis.com/home/item.html?id=69e12682738e467eb509d8b54dc73cbd credit: "Los Angeles GeoHub" }).then((dataSource) => { dataSource.name="trails"; viewer.dataSources.add(dataSource); const entities = dataSource.entities.values; for (let i=0; i<entities.length;i++) { const trail = entities[i]; trail.polyline.width = 3 + (4* trail.properties.ELEV_GAIN._value)/2300; trail.polyline.material = Cesium.Color.fromCssColorString('#FCADF9'); trail.polyline.zIndex = 2; } }) })
Style parks (polygons) by type
You can create a categorical rendering of parks based on their attribute values. Render the polygon features from the Parks and Open Space feature layer with different colors based on the type of land they represent.
-
Call the
arcgisopeartion to make an authenticated request to the Parks and Open Space URL. Format the response as GeoJSON and add it to the scene as aRest.query Features Geo.Json Data Source Use dark colors for code blocks const polygonLayerURL = "https://services3.arcgis.com/GVgbJbqm8hXASVYi/arcgis/rest/services/Parks_and_Open_Space/FeatureServer/0"; arcgisRest.queryFeatures({ url: polygonLayerURL, authentication, f:"geojson" }).then((response) => { Cesium.GeoJsonDataSource.load(response,{ clampToGround:true, }).then((dataSource) => { dataSource.name="parks" viewer.dataSources.add(dataSource); }) }) -
Add the data attribution for the feature layer source.
- Go to the Parks and Open Space item.
- Scroll down to the Credits (Attribution) section and copy its value.
- Create an
attributionproperty and paste the attribution value from the item.Use dark colors for code blocks const polygonLayerURL = "https://services3.arcgis.com/GVgbJbqm8hXASVYi/arcgis/rest/services/Parks_and_Open_Space/FeatureServer/0"; arcgisRest.queryFeatures({ url: polygonLayerURL, authentication, f:"geojson" }).then((response) => { Cesium.GeoJsonDataSource.load(response,{ clampToGround:true, // Attribution text retrieved from https://arcgis.com/home/item.html?id=f2ea5d874dad427294641d2d45097c0e credit: "Los Angeles GeoHub" }).then((dataSource) => { dataSource.name="parks" viewer.dataSources.add(dataSource); }) })
-
The
TYPEattribute of the layer contains four different types of parks and open spaces. Define a unique color for each category.Use dark colors for code blocks const polygonLayerURL = "https://services3.arcgis.com/GVgbJbqm8hXASVYi/arcgis/rest/services/Parks_and_Open_Space/FeatureServer/0"; arcgisRest.queryFeatures({ url: polygonLayerURL, authentication, f:"geojson" }).then((response) => { Cesium.GeoJsonDataSource.load(response,{ clampToGround:true, // Attribution text retrieved from https://arcgis.com/home/item.html?id=f2ea5d874dad427294641d2d45097c0e credit: "Los Angeles GeoHub" }).then((dataSource) => { dataSource.name="parks" viewer.dataSources.add(dataSource); const parkColors = { "Natural Areas": "#9E559C", "Regional Open Space": "#A7C636", "Local Park": "#149ECE", "Regional Recreation Park": "#ED5151" }; }) }) -
Iterate through all entities and set the
polygonmaterial of each entity based on theTYPEof park.Use dark colors for code blocks const polygonLayerURL = "https://services3.arcgis.com/GVgbJbqm8hXASVYi/arcgis/rest/services/Parks_and_Open_Space/FeatureServer/0"; arcgisRest.queryFeatures({ url: polygonLayerURL, authentication, f:"geojson" }).then((response) => { Cesium.GeoJsonDataSource.load(response,{ clampToGround:true, // Attribution text retrieved from https://arcgis.com/home/item.html?id=f2ea5d874dad427294641d2d45097c0e credit: "Los Angeles GeoHub" }).then((dataSource) => { dataSource.name="parks" viewer.dataSources.add(dataSource); const entities = dataSource.entities.values; for (let i=0; i<entities.length;i++) { const park = entities[i]; if (park.polygon == null) { continue; } const color = Cesium.Color.fromCssColorString(parkColors[park.properties.TYPE._value]); color.alpha = 0.7 park.polygon.material = color; park.polygon.zIndex=1; park.polygon.outline = false; } }) })
Run the app
Run the app.
Your map should display the trailheads, trails, and open spaces in the Santa Monica Mountains:
- Each trailhead should be represented with a hiker icon.
- Each trail should have a custom width based on its total elevation gain.
- Each park should be assigned a color based on its type.
What's next?
Learn how to use additional ArcGIS location services in these tutorials:


