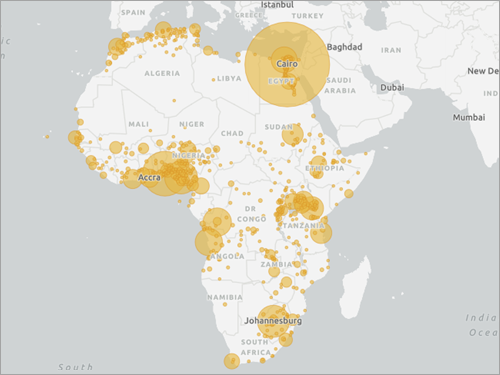
ArcGIS StoryMaps is primarily used for creating interactive stories with maps, multimedia content, and text narrative. While it is not a development framework, you can still use it in different ways for application prototyping and development work.
Why use ArcGIS StoryMaps?
Below are scenarios of using ArcGIS StoryMaps for app prototyping:
App design scenarios
Test an application design scenario and incorporate maps, images, and text to describe the test requirements, objectives, and steps.
-
Collect feedback
Incorporate interactive elements like surveys to gather feedback or assess knowledge related to your tests. This can be useful for conducting user acceptance testing or gathering insights from testers.
-
Display data
Visualize and analyze test data by creating charts and graphs to represent the data and correlations. This provides a comprehensive overview of the testing outcomes.
-
Share and collaborate
Share your stories with others and collaborate on them. This can be valuable when multiple testers or stakeholders need to review and provide feedback on testing procedures, results, or any issues encountered during the testing process.
Examples
Below are examples of how ArcGIS StoryMaps can be used to showcase new app designs or convey status updates.
Share app designs
Share Figma wireframes
ArcGIS StoryMaps does not have direct integration with Figma or other wireframing tools. However, you can manually add Figma wireframes into your ArcGIS StoryMaps.

-
Export Wireframes from Figma:
- In Figma, export your wireframes as images (PNG or JPEG files) or PDF files.
-
Create a new story:
- Log in to your ArcGIS organization and create a new story.
-
Add a Section or Block:
- Within the story, add a new section or block where you want to include the wireframes.
-
Add an Interactive Content Block or Media Block:
- Choose the appropriate layout for the section, such as a media block or interactive content block.
-
Add Image or Link:
- In the selected block, you can either add the image directly if it's an image block, or add a link if it's an interactive content block.
- If adding a link, use the shareable link from your online storage for each wireframe.
-
Repeat for Each Wireframe:
- Repeat the process for each wireframe you want to include in your story.
-
Adjust Layout and Captions (if needed):
- Arrange the wireframes as needed within the section.
- You can also add captions or descriptions to each wireframe to explain its purpose.
-
Preview and Publish:
- Preview your StoryMap to ensure the wireframes are displaying correctly.
- Once satisfied, publish your StoryMap.
Crowdsource reporting
Citizen report survey
Create a crowdsource reporting app that allows users to report wildlife sightings by accessing a Survey123 form directly from your StoryMap.

-
Create a Survey in ArcGIS Survey123:
- Design a simple survey form in ArcGIS Survey123 with fields for sighting details like species, location, and date.
- Publish the survey to make it accessible.
-
Create or Edit a StoryMap:
- Log in to your ArcGIS StoryMaps account.
- Create a new StoryMap or edit an existing one where you want to integrate the survey.
-
Add a Section for the Survey:
- Add a new section to your StoryMap dedicated to showcasing the Survey123 form.
-
Add Interactive Content Block:
- In the new section, add an interactive content block.
-
Embed the Survey123 Form:
- From your Survey123 form, obtain the embed code for the form.
- Paste the embed code into the interactive content block within your StoryMap.
-
Adjust Layout and Text (if needed):
- Arrange the block to suit your StoryMap's design.
- Add a brief description or introduction to explain what the survey is about.
-
Preview and Test:
- Preview your StoryMap to make sure the embedded survey is working correctly.
- Test the survey interaction to ensure users can fill out and submit the form directly from the StoryMap.
-
Publish and Share:
- Once you're satisfied, publish your StoryMap.
- Share the StoryMap's link with your audience to demonstrate how the survey is integrated.
Display status updates
You can create a testing report that communicates the testing process, results, and conclusions. It offers a unique way to combine information, multimedia content, and storytelling elements to enhance the testing experience.
Mobile app testing
In this example, you are conducting a field-based usability test for a mobile application that provides navigation services. You want to document the test process, capture feedback, and visualize the test locations.

- Create a story
Create a new story in ArcGIS StoryMaps.
-
Introduction
Begin your story with an introductory section that provides an overview of the testing process. Explain the objectives, the app being tested, and the test scenario.
-
Map Locations
Embed a map within your story and mark the specific locations where the usability test will be conducted. You can add points of interest, such as landmarks or specific areas where participants will interact with the app.
-
Test Scenarios
Create individual sections in your story for each test scenario. Describe the scenario, including the specific actions participants need to perform in the app.
- Add participant feedback
Add a section to gather feedback from participants. You can include a survey created in ArcGIS Survey123 within the story to collect their responses. Alternatively, you can provide a link to an external survey tool.
- Display testing results
Add a section to display results from user acceptance testing.
-
Visual elements
Use ArcGIS Dashboards charts in the story to visualize the test results. For example, you can create a chart in a dashboard showing the number of participants who encountered specific usability issues.
-
Conclusion
Conclude your story with a summary of the test findings, key insights, and recommendations for improving the usability of the mobile app. You can include text, images, or videos to support your conclusions.
- Sharing and Collaboration
Share the story with your team members, stakeholders, or developers involved in the development of the mobile app.
Tutorials

Customize a theme for impactful stories
Recreate an award-winning theme from the 2020 ArcGIS StoryMaps Competition to get to know the capabilities of the StoryMaps theme builder.
ArcGIS Online Location Platform dashboard

Build a sidecard in your story
Use a sidecar to allow others to access your mapped data one step at a time.
ArcGIS Online Location Platform dashboard