1. Choose a style
The first step is to determine which type of style to use. If you want to display a single symbol for all features, use a simple style. If you want to display different symbols for features based on attributes, use a data-driven style. The most common styles are listed below.
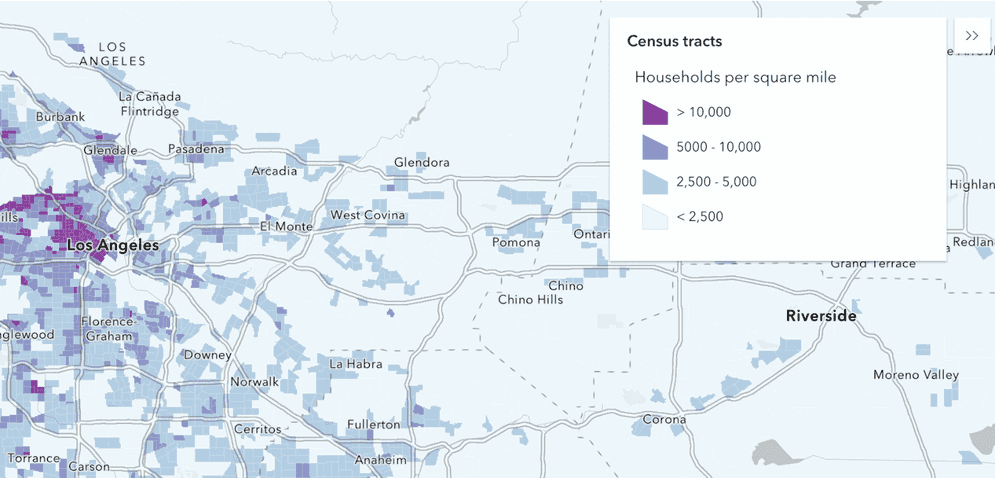
Simple styles are a single set of visual properties applied to all features in a feature layer.
Style | Description | Example |
---|---|---|
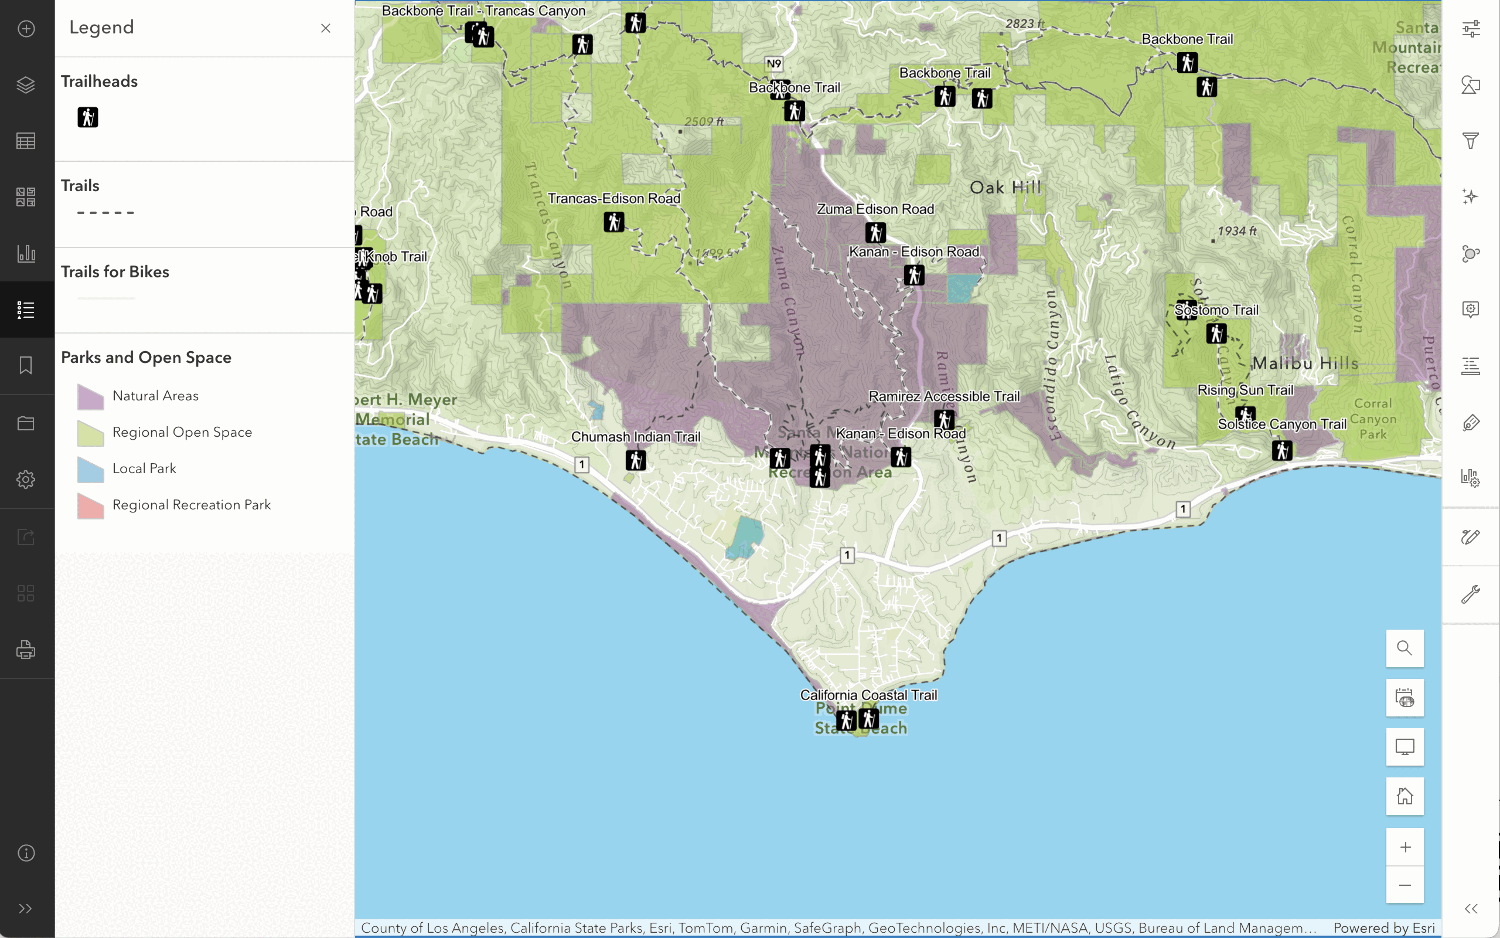
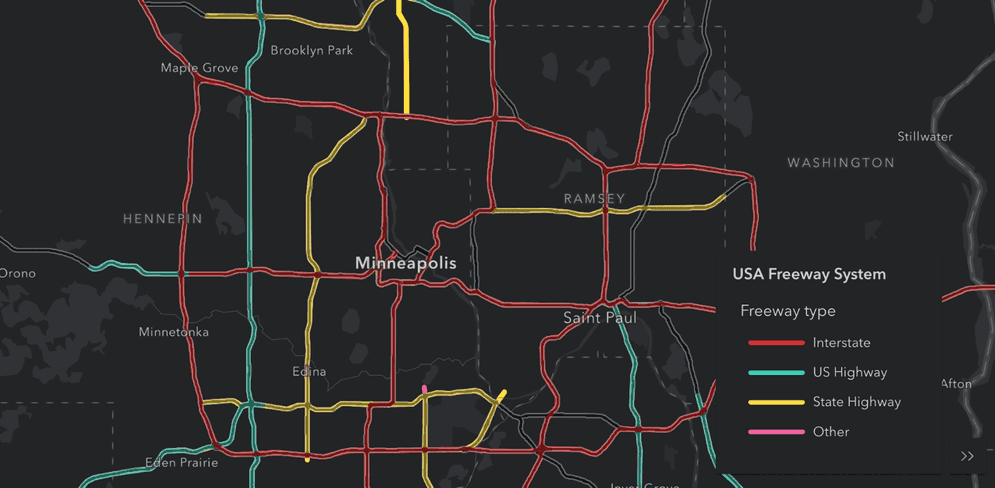
2D symbols | To style point, line, and polygon geometries in a map. |
![]() |
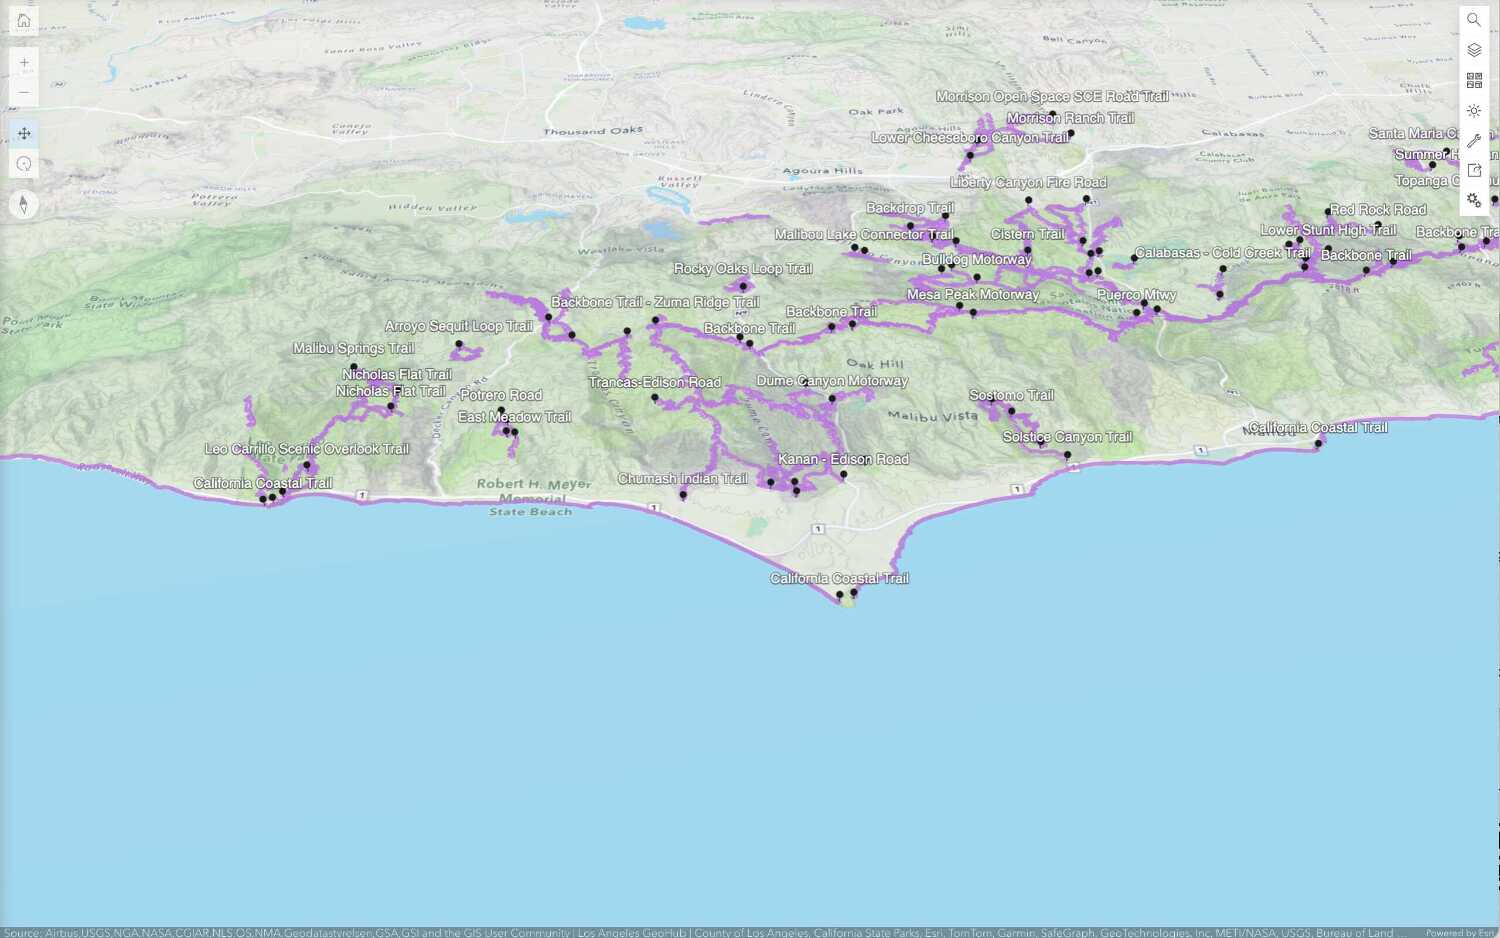
3D symbols | To style point, line, and polygon geometries in a scene. |
![]() |
A unique type style assigns distinct symbols to unique data values returned from a field or expression in a layer.
Style | Description | Example |
---|---|---|
Categorical data (2D) | Visualize data based on a category such as region or type. |
![]() |
Categorical data (3D) | Visualize data based on a category such as region or type in a scene. |
![]() |
Ordinal data | Visualize ordinal data such as high, medium, and low. |
![]() |
A class breaks style allows you to visualize numeric ranges of data.
Style | Description | Example |
---|---|---|
Attributes | Visualize a range of numeric data values normalized by another attribute. |
![]() |
Area | Visualize a range of values normalized by the area of a polygon. |
![]() |
Visual variables are objects that allow you to override one or more properties of a renderer's symbols based on a numeric data value returned from a field or an expression.
Style | Description | Example |
---|---|---|
Color | Visualize the color of a symbol based on a numeric data value returned from a field or expression. |
![]() |
Size | Visualize the size of a symbol based on a numeric data value returned from a field or expression. |
![]() |
Opacity | Visualize the opacity of a symbol based on a numeric data value returned from a field or expression. |
![]() |
Rotation | Visualize the rotation of a symbol based on a numeric data value returned from a field or expression. |
![]() |
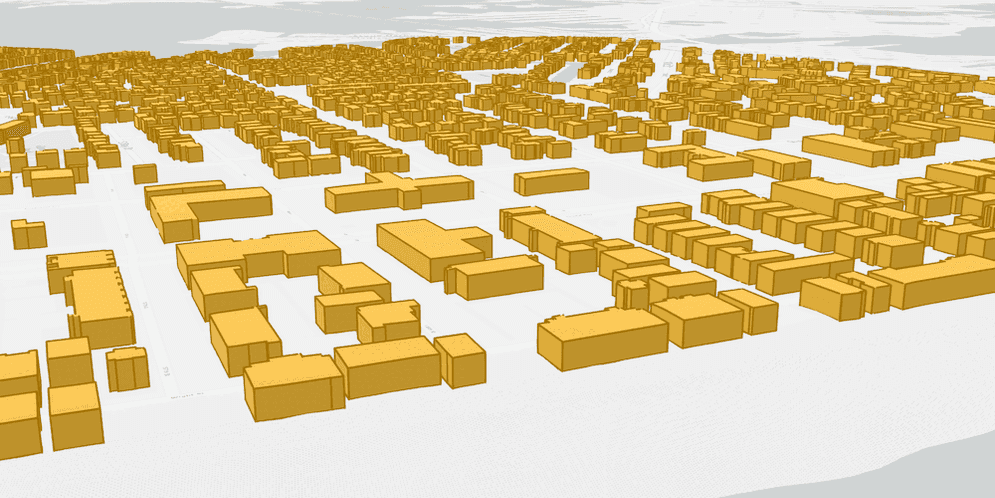
2. Define the symbols and renderer
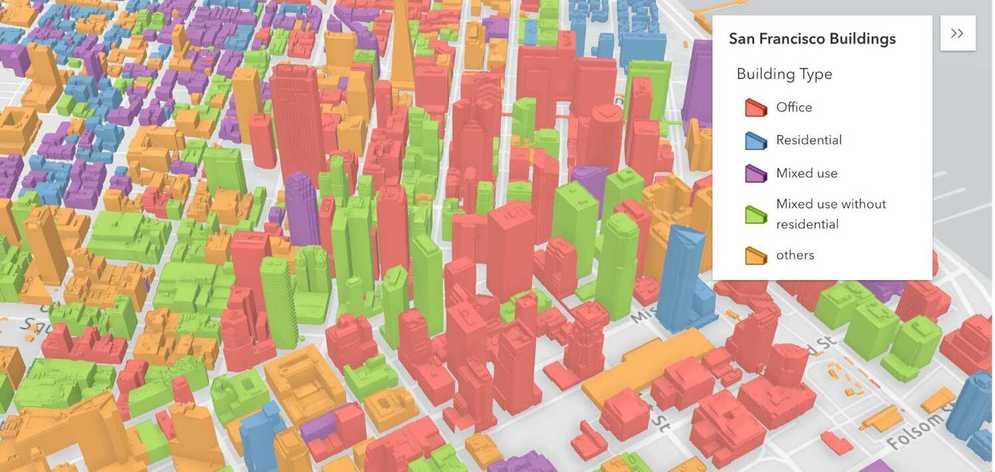
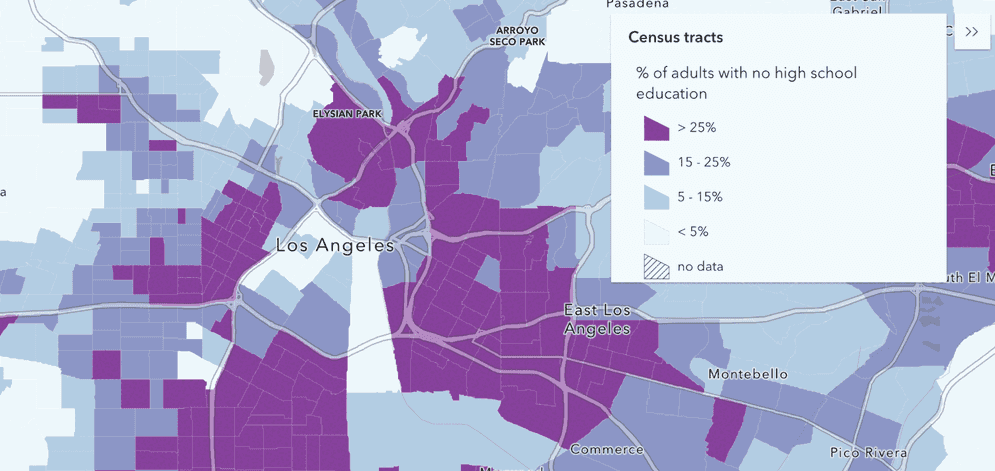
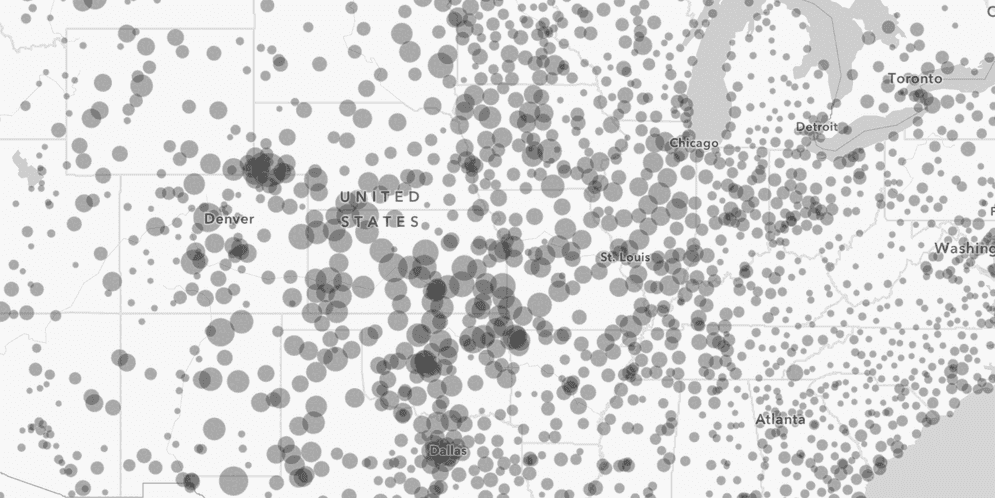
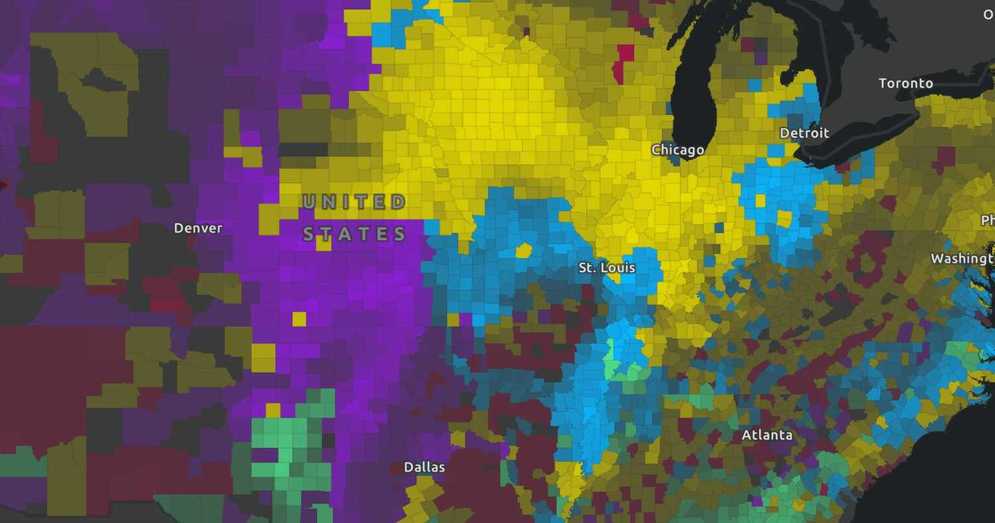
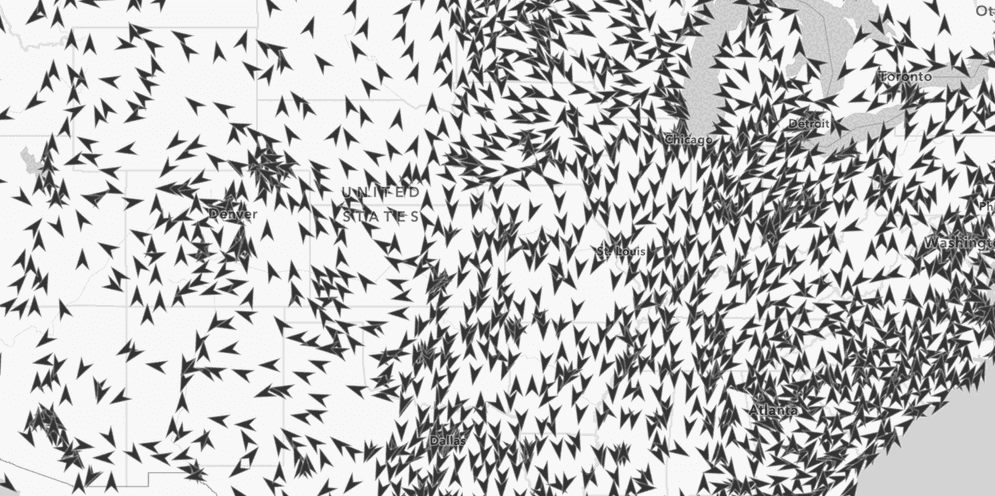
The next step is to define one or more symbols and a renderer with an ArcGIS Maps SDK. Each symbol contains a unique set of style properties. Typical properties are color, size, fill color, outline size and color, and transparency. A renderer is responsible for assigning each feature a symbol. A simple renderer defines one symbol for all features. Data-driven renderers define multiple symbols that are assigned to features based on attribute values.
The steps to define the style are:
- Create and define symbols.
- Create the renderer.
- Set the symbols to the renderer.
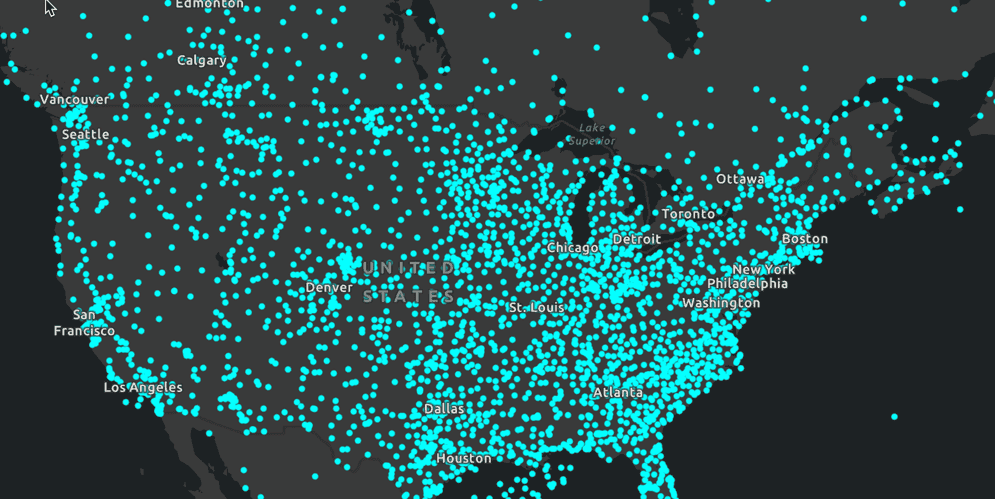
This example illustrates how to create 2D point symbols and define a simple renderer using ArcGIS Maps SDKs.
const renderer = new SimpleRenderer({
symbol: new SimpleMarkerSymbol({
size: 4,
color: [0, 255, 255],
outline: null
})
});
This example illustrates how to style categorical data with a unique value renderer using ArcGIS Maps SDKs.
const hwyRenderer = {
type: "unique-value",
legendOptions: {
title: "Freeway type",
},
defaultSymbol: otherSym,
defaultLabel: "Other",
field: "RTTYP",
uniqueValueInfos: [
{
value: "I", // code for interstates/freeways
symbol: fwySym,
label: "Interstate",
},
{
value: "U", // code for U.S. highways
symbol: hwySym,
label: "US Highway",
},
{
value: "S", // code for State highways
symbol: stateSym,
label: "State Highway",
},
],
}
This example illustrates how to style data by attribute with a class breaks renderer using ArcGIS Maps SDKs.
const renderer = {
type: "class-breaks",
field: "NOHS_CY",
normalizationField: "EDUCBASECY",
legendOptions: {
title: "% of adults with no high school education"
},
defaultSymbol: {
type: "simple-fill",
color: "black",
style: "backward-diagonal",
outline: {
width: 0.5,
color: [50, 50, 50, 0.6]
}
},
defaultLabel: "no data",
classBreakInfos: [
{
minValue: 0,
maxValue: 0.04999,
symbol: createSymbol("#edf8fb"),
label: "< 5%"
},
{
minValue: 0.05,
maxValue: 0.14999,
symbol: createSymbol("#b3cde3"),
label: "5 - 15%"
},
{
minValue: 0.15,
maxValue: 0.24999,
symbol: createSymbol("#8c96c6"),
label: "15 - 25%"
},
{
minValue: 0.25,
maxValue: 1.0,
symbol: createSymbol("#88419d"),
label: "> 25%"
}
]
};
This example illustrates how to style by color based on numeric data values using visual variables in the renderer with the JavaScript Maps SDK.
const renderer = {
type: "simple",
symbol: {
type: "simple-marker",
style: "circle",
color: [250, 250, 250],
outline: {
color: [255, 255, 255, 0.5],
width: 0.5
},
size: "8px"
},
visualVariables: [
{
type: "color",
field: "TEMP",
stops: [
{ value: 20, color: "#2b83ba" },
{ value: 35, color: "#abdda4" },
{ value: 50, color: "#ffffbf" },
{ value: 65, color: "#fdae61" },
{ value: 80, color: "#d7191c" }
]
}
]
};
3. Display the style
The last step is to use an ArcGIS Maps SDK to access and display the features on a map.
The steps to display the style are:
- Reference the feature layer by using a service URL or its item ID.
- Set the renderer property of the layer.
- Add the layer to the map.
//Set the renderer on the layer
const weatherStations = new FeatureLayer({
portalItem: {
id: "cb1886ff0a9d4156ba4d2fadd7e8a139"
},
renderer: renderer
});
// Set the renderer on the layer
const hwyLayer = new FeatureLayer({
url:
"https://services.arcgis.com/P3ePLMYs2RVChkJx/ArcGIS/rest/services/TIGER_Roads_2021_view/FeatureServer/0",
renderer: hwyRenderer,
title: "USA Freeway System",
minScale: 0,
maxScale: 0,
definitionExpression: "MTFC = 'Primary Road'",
orderBy: [
{
valueExpression: `
Decode( $feature.RTTYP,
"I", 1,
"U", 2,
"S", 3,
"M", 4,
100 );
`,
order: "ascending",
},
],
})
// Set the renderer of the feature layer
const layer = new FeatureLayer({
portalItem: {
id: "1cbb0faa0f1f424bbe213bfae9319309"
},
title: "Census tracts",
renderer: renderer,
popupTemplate: {
content: "{NOHS_CY} adults 25 years old and older in this census tract did not attend high school."
},
opacity: 1
});
// Set the renderer on the feature layer
const layer = new FeatureLayer({
portalItem: {
id: "cb1886ff0a9d4156ba4d2fadd7e8a139"
},
title: "Current weather conditions",
renderer: renderer
});
const map = new Map({
basemap: {
portalItem: {
id: "ba223f982a3c4a0ea8c9953346e2a201"
}
},
layers: [layer]
});
Additional resources
Tutorials
![](/documentation/static/style-a-feature-layer-3f0ccd11611955906e57874ecf0114f2.png)
Style a feature layer
Use symbols and renderers to style feature layers.