What are simple styles?
A simple style is a single set of visual properties applied to all features in a feature layer. The visual properties are defined by a symbol and a simple renderer. When a feature layer is displayed in a map, all features are treated and displayed equally. A simple style just shows the location of a feature and the visual properties are not determined by the attributes or data values associated with it.
You use simple styles when you want to:
- Style all features (points, lines, and polygons) the same
- Style features based on their location
- Create a uniform visualization for all features
- Not emphasize or deemphasize features
- Not use a data-driven approach to visualize features
How to create a simple style
In general, there are two ways to style features:
-
Apply symbols to graphics: You use this approach when you need to display the location for temporary graphics in a map or scene. The symbol type must match the geometry type of the graphic. Learn more about how to create graphics in Graphics.
-
Apply a renderer (with symbols) to a data layer: You use this approach when you want to style all features in a data layer in a map or scene. A renderer defines the "rules" for applying symbols to features, and the symbols define the style used to display the feature. Learn more about layers that support features in Data layers.
Symbols
There are many different types of symbols you can use to style features. The type of symbol you use depends on the type of visualization you would like to create. It also depends on the type of geometry the feature supports. 2D symbols are used to display features in a map, and 3D symbols are used to display features in a scene. The most common type of symbol is a simple symbol.
2D Symbols
You use 2D symbols to style point, line, and polygon geometries and display them in a map. The main types are marker, picture, and text symbols. See below for more examples.
const symbol = new SimpleMarkerSymbol({
color: "rgba(0,128,155,0.8)",
size: "10px",
outline: new SimpleLineSymbol({
width: 0.5,
color: "rgba(255,255,255,0.3)"
})
});3D Symbols
You use 3D symbols to style point, line, polygon, and mesh geometries and display them in a scene. In a scene, you can choose between two types of symbols:
- 2D symbols such as marker symbols, line symbols and polygon fill symbols.
- 3D symbols such as 3D model symbols, path symbols and extruded polygon symbols.
See below for more examples.
const pointSymbol = new PointSymbol3D({
symbolLayers: [ new IconSymbol3DLayer({
resource: { href: "pin.svg" },
size: 15,
material: {
color: "#4c397f"
},
anchor: "bottom"
})]
});Simple renderer
The most common type of renderer is a simple renderer. You use a simple renderer to style all of the features in a data layer the same. Using a simple renderer, all visual properties of the symbol (e.g. size, color, opacity, texture, etc.) are fixed for each feature. The primary purpose of the visualization is to show where a feature is located, not specifics about the feature's attributes. For example, if you want to know the locations of weather stations, but you do not need to know additional attribute information about each station, you should render all points with the same symbol.
const renderer = new SimpleRenderer({
symbol: new SimpleMarkerSymbol({
size: 4,
color: [0, 255, 255],
outline: null
})
});
2D examples
Points
To visualize the location of point features in a map, set a simple marker symbol, picture marker symbol, or a CIM symbol in a simple renderer, and set the renderer on the layer. All features will display in the view with the same symbol.
This example visualizes the locations of weather stations.
- Create a simple marker symbol and add it to a simple renderer.
- Set the renderer to a data layer.
const renderer = new SimpleRenderer({
symbol: new SimpleMarkerSymbol({
size: 4,
color: [0, 255, 255],
outline: null
})
});
Lines
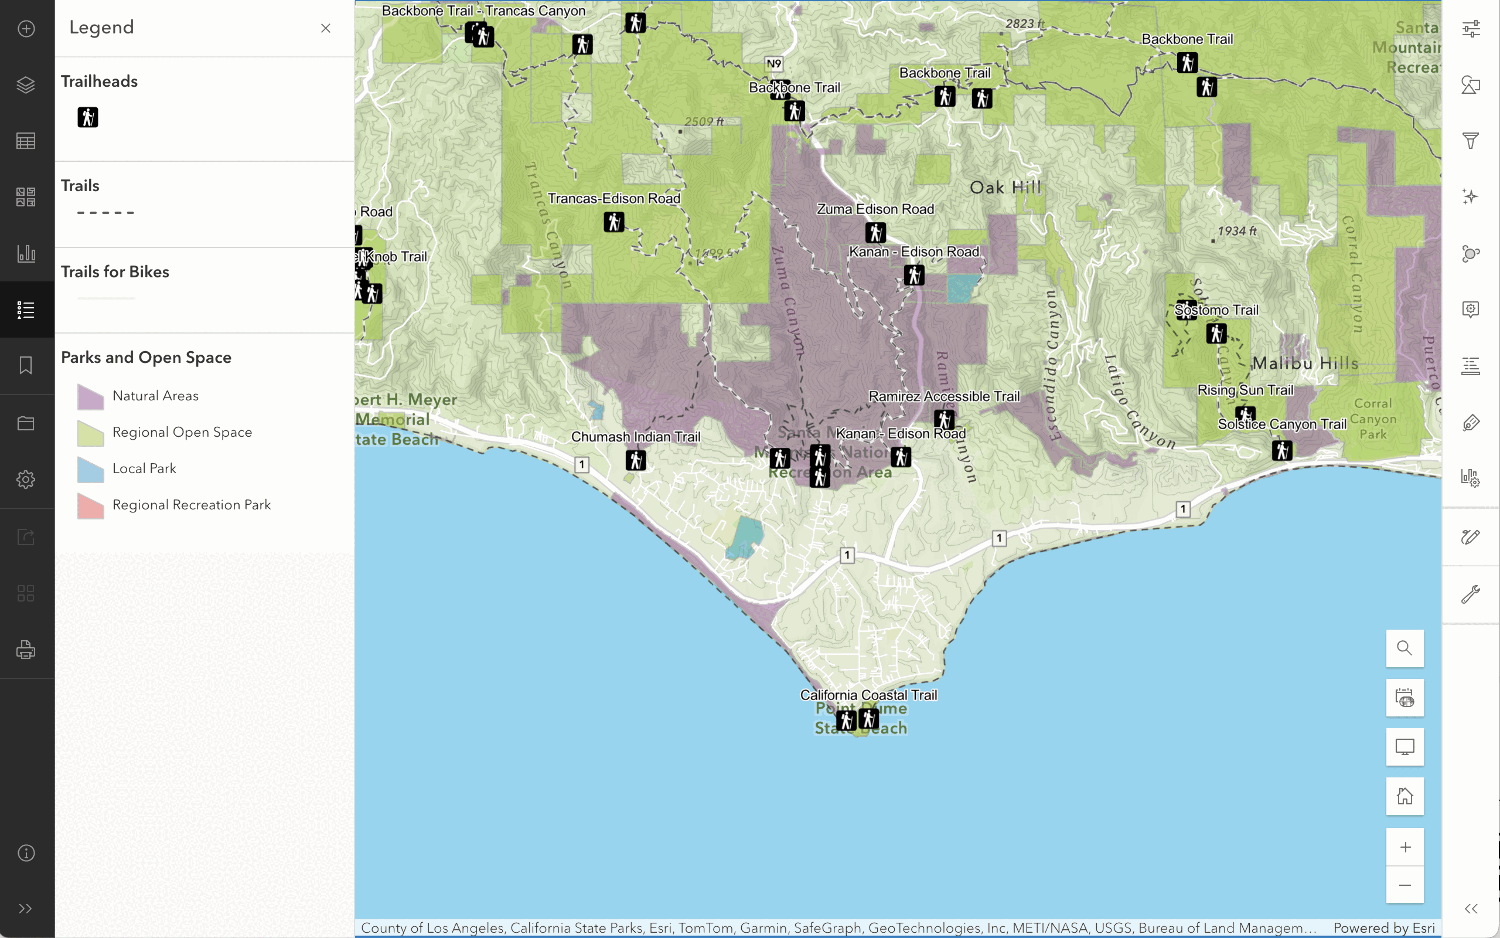
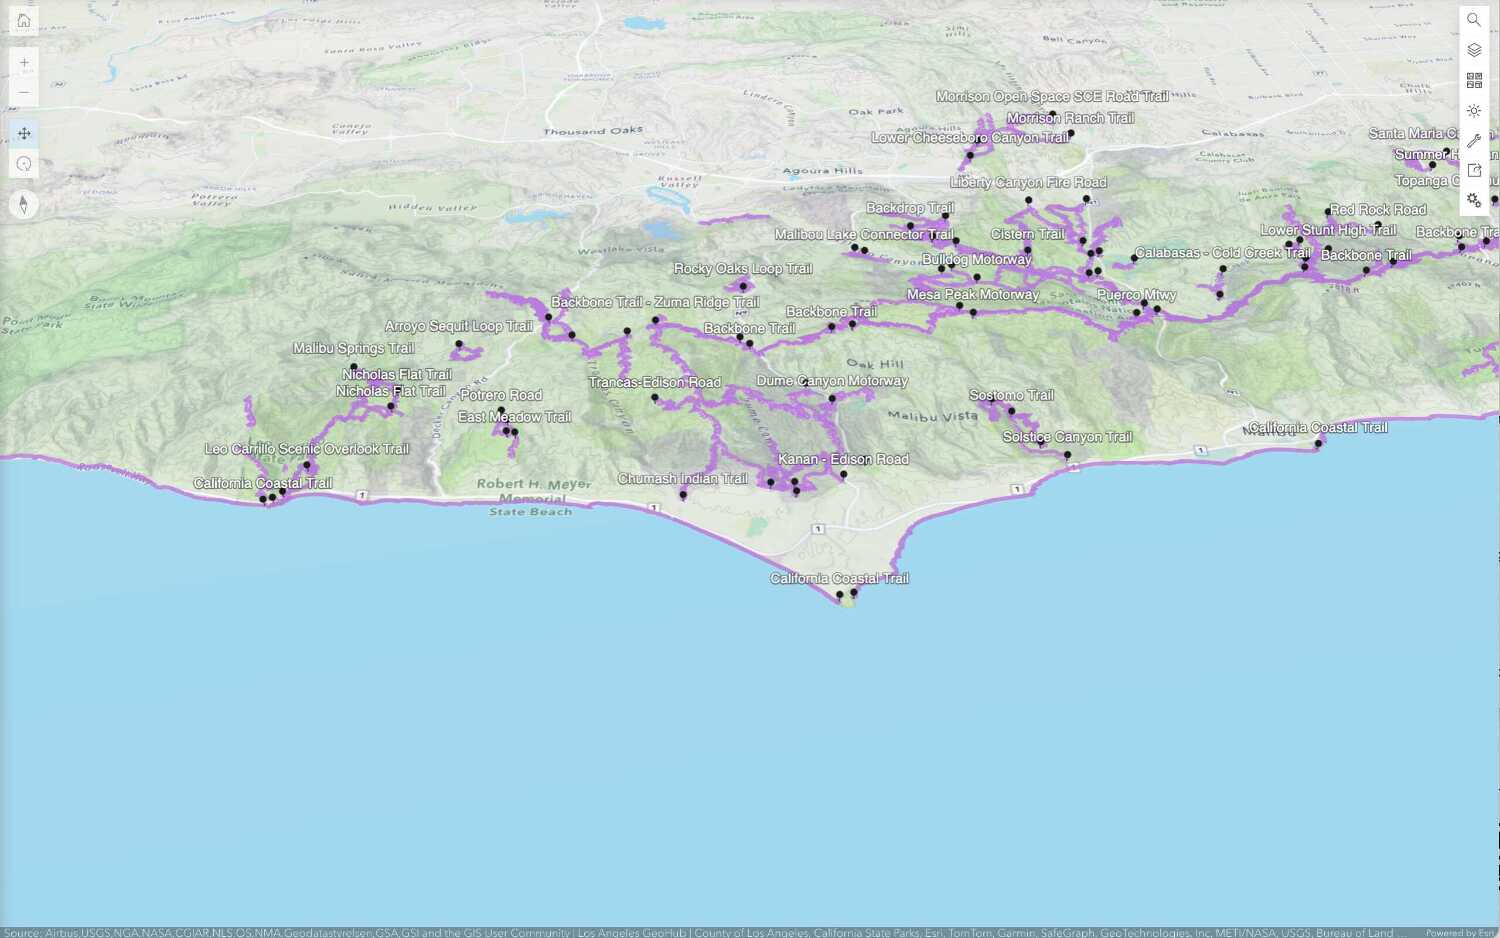
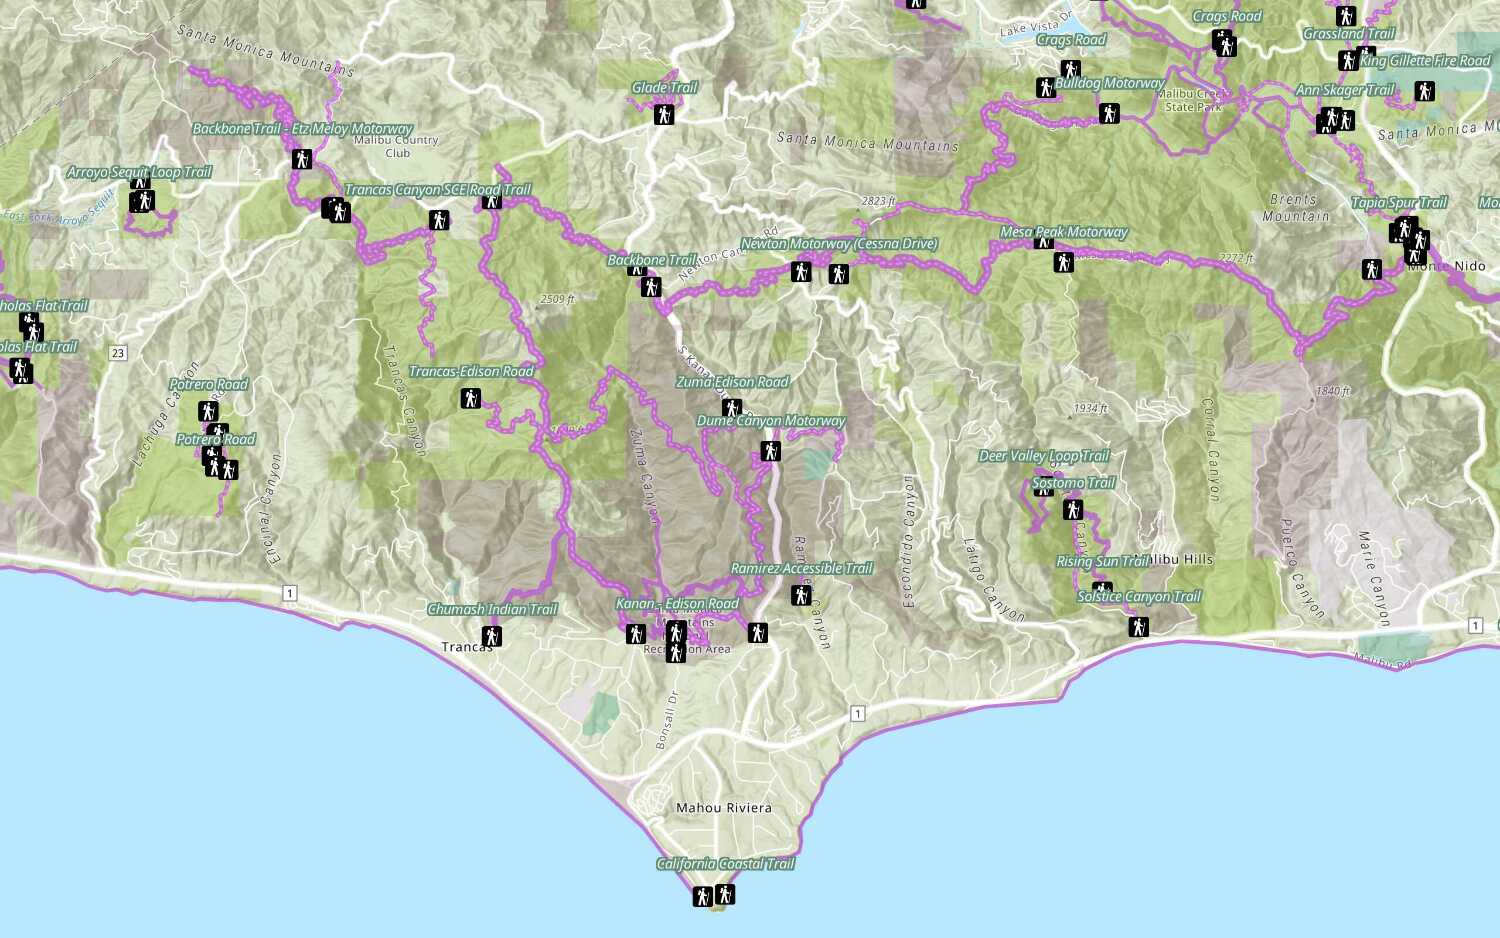
To visualize the location of line features in a map, use a simple line symbol or a CIM symbol, and a simple renderer .
This example displays the locations of major highways using a single symbol.
Steps
- Create a simple line symbol and add it to a simple renderer .
- Set the renderer to the data layer.
const renderer = new SimpleRenderer({
symbol: new SimpleLineSymbol({
width: 1,
color: "#fb12ff",
}),
})
Polygons
To visualize the location of polygon features in a map, you can use a number of different symbol types such as a simple fill symbol, picture fill symbol, simple marker symbol, picture marker symbol, web style symbol, or a CIM symbol.
This example visualizes the borders of the states in the U.S. with very transparent polygons.
Steps
- Create a simple fill symbol and add it to a simple renderer.
- Set the renderer to the data layer.
const renderer = new SimpleRenderer({
symbol: new SimpleFillSymbol({
color: "rgba(249, 249, 199, .05)",
outline: {
color: "white",
width: .15
}
})
});
3D examples
Points
To visualize the location of point features in a scene, set a marker symbol or a 3D model symbol in a simple renderer, and set the renderer on the layer. All features will display in the view with the same symbol. This example shows how to create a globe that displays cities all over the world. The symbol for the cities is a pin marker.
Steps
- Create a marker symbol and add it to a simple renderer .
- Apply the renderer to the data layer so that each feature is displayed with the marker symbol.
const renderer = new SimpleRenderer({
symbol: new PointSymbol3D({
symbolLayers: [
new IconSymbol3DLayer({
resource: {
href:
"https://static.arcgis.com/arcgis/styleItems/Icons/web/resource/Pushpin3.svg",
},
size: 15,
material: {
color: "#4c397f",
},
anchor: "bottom",
}),
],
}),
});
Lines
To visualize the location of line features in a scene, set a line symbol or a 3D path symbol in a simple renderer, and set the renderer on the layer. This example shows how to style the streets in Manhattan using a path symbol.
Steps
- Create a path symbol with a width and a height of 10 meters.
- Add it to a simple renderer.
- Apply the renderer to the data layer.
const renderer = new SimpleRenderer({
symbol: new LineSymbol3D({
symbolLayers: [
new PathSymbol3DLayer({
profile: "quad",
material: {
color: [46, 255, 238],
},
width: 10,
height: 10,
join: "miter",
cap: "round",
anchor: "bottom",
profileRotation: "all",
}),
],
}),
})
Polygons
To visualize polygon features in a scene, use a fill symbol or extrude the polygon based on real-world heights. The example below extrudes building footprints with a fixed height to display schematic buildings in a city.
Steps
- Create an extruded polygon symbol and add it to a simple renderer.
- Apply the renderer to the data layer.
const renderer = new SimpleRenderer({
symbol: new PolygonSymbol3D({
symbolLayers: [
new ExtrudeSymbol3DLayer({
material: {
color: "#ffc53d",
},
size: 10,
edges: {
type: "solid",
color: "#a67400",
size: 1.5,
},
}),
],
}),
})
Tutorials
Style a feature layer
Use symbols and renderers to style feature layers.