What is a data layer?
A data layer, also known as an operational layer, is a client-side layer that can access geographic data from a data source. You use a data layer to display geographic data on top of a basemap layer in a map or scene. The data source for the layer can be a data service or a file such as a Shapefile or GeoJSON file.
You can use data layers to:
- Display feature or tile data from feature services, vector tile services, or image tile services.
- Display layers with renders and symbols (data-driven styles).
- Access data through SQL and spatial queries.
- Provide access to data attributes for point, line, and polygon feature data.
- Add, update, and delete feature data.
How a data layer works
A data layer provides access to geographic data that is displayed in a map or scene. Each layer references a file or service data source. The data source contains either as vector data (points, lines, polygons and attributes) or raster data (images). Different types of layers can access and display different types of data.
The data for a data layer is typically stored in ArcGIS as a data service. You can use feature services, vector tile services, and image tile services to host your data. Learn more in Data hosting.
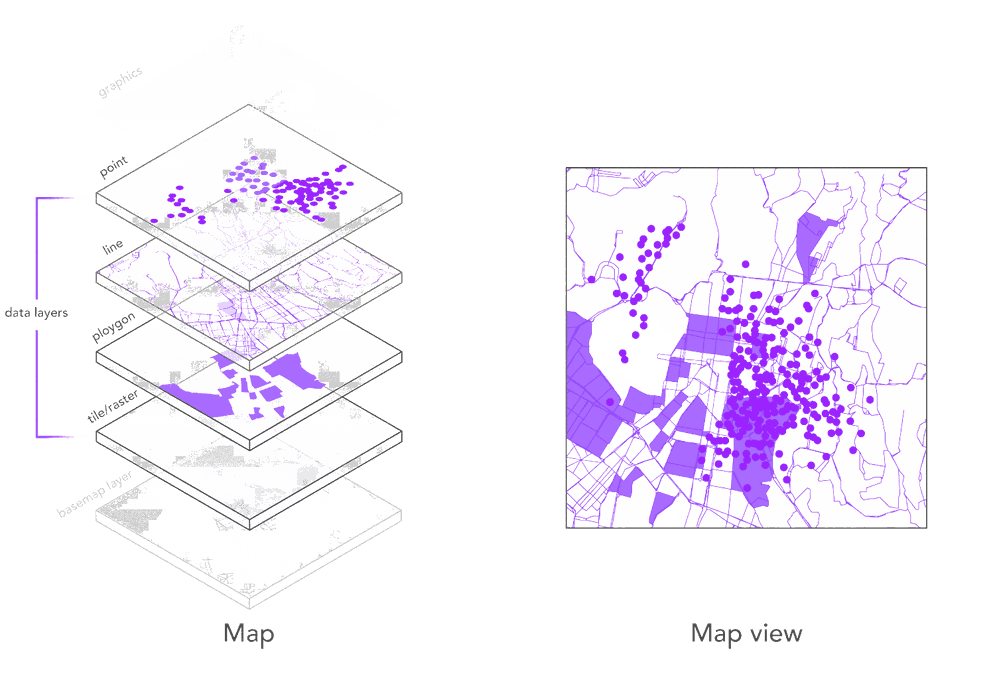
To add a data layer to a map or scene, you typically add imagery or tile layers first, and then polygons, lines, and points layers last. A map or scene controls the order of the layers, and the map or scene view combines the layers to create the final display.

Figure 1: Data layers are added on top of a basemap layer.
Types of data layers
You can use different types of data layers to access and display different types of data in your applications. Data layers can access ArcGIS data sources and other types of data sources such as OGC data and files.
Different data layers provide different types of functionality. The functionality available is largely dependent on the capabilities of the API and the data source. For example, a feature layer can access a feature service and perform queries, edits, and data export, whereas a vector tile layer can only access tiles from a vector tile service.
ArcGIS data layers
The following layers work with ArcGIS data sources.
| Layer | Data type | Display | Query | Edit | Offline* | Data sources |
|---|---|---|---|---|---|---|
| Feature layer | Feature | 2D/3D | True | True | True | Feature service, shapefile, geodatabase |
| Vector tile layer | Vector Tile | 2D/3D** | False | False | True | Vector tile service, vector tile package (.vtpk) |
| Feature collection layer | Feature | 2D/3D | True | True | True | Portal item, web map, feature set / query result |
| Annotation layer*** | Feature | 2D | True | True | True | Feature service |
| Tile layer | Image Tile | 2D/3D | False | False | True | Tile service, tile package (.tpk/.tpkx) |
| Raster/Imagery layer | Raster | 2D/3D | False | False | True | Image service (ASRP/USRP, CRF, DTED, GeoTIFF/TIFF, HFA, HRE, IMG, JPEG, JPEG2000, NITF, PNG, RPF, SRTM (HGT), USGS DEM) |
| Scene layer | I3S | 3D | False | False | True | Scene service |
| Map image layer | Image | 2D/3D | False | False | True | Map service (Offline requires local server) |
| Stream layer | Feature | 2D/3D | False | False | False | Stream service |
| * Offline layers can be used with ArcGIS Maps SDKs for Native Apps. |
** ArcGIS Maps SDK for JavaScript only.
*** ArcGIS Maps SDKs for Native Apps only.
OGC data layers
The following layers work with OGC data sources.
| Layer | Data type | Display | Query | Edit | Offline* | Data sources |
|---|---|---|---|---|---|---|
| Feature layer | Feature | 2D/3D | True | True | True | WFS, GeoPackage |
| Raster layer | Raster | 2D/3D | True | False | True | GeoPackage |
| KML layer | Feature/Image | 2D/3D | True | True | True | KML file (.kml, .kmz) |
| WMS layer | Image | 2D/3D | False | False | False | WMS service |
| WMTS layer | Image Tile | 2D/3D | False | False | False | WMTS service |
| OGC feature layer | Feature | 2D/3D | False | False | False | OGC API Features service |
| * Offline layers can be used with the ArcGIS Maps SDKs for Native Apps. |
Other data layers
The following layers work with non-ArcGIS data sources.
| Layer | Data type | Display | Query | Edit | Offline* | Data sources |
|---|---|---|---|---|---|---|
| CSV layer** | Feature | 2D/3D | True | False | False | CSV file (.csv) |
| GeoJSON layer** | Feature | 2D/3D | True | True | False | GeoJSON file or service |
| OpenStreetMap layer | Vector Tile | 2D/3D | False | False | True | OSM Vector tile service |
| Vector tile layer | Vector Tile | 2D/3D** | False | False | False | Vector tile service (Mapbox specification) |
| Web tile layer | Image Tile | 2D/3D | False | False | False | {level},{row},{col} Image tile service |
| Raster/Imagery layer*** | Raster | 2D/3D | False | False | False | Raster files e.g. GeoTiff, Mr. Sid |
| * Offline layers can be used with the ArcGIS Maps SDKs for Native Apps. |
** ArcGIS Maps SDK for JavaScript API only.
*** ArcGIS Maps SDKs for Native Apps only.
Code examples
Display feature data from a feature service
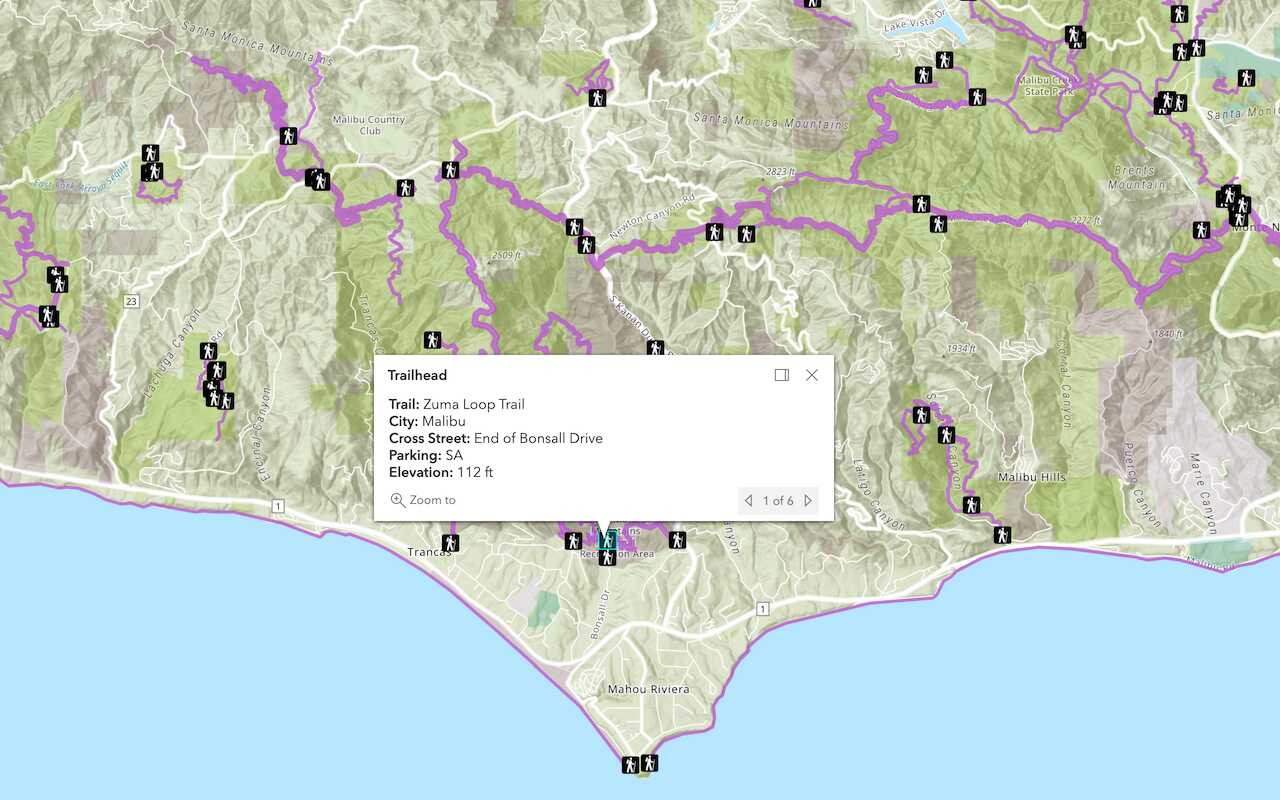
This example uses a feature layer to access and display features from a feature service. A feature layer is used to display points, lines, or polygons from a layer in a feature service. To access attribute values, they need to be requested from the service. You can also override the default symbols for the features by using a renderer. Learn more about renderers in Styles and data visualization.
Steps
- Create a map or scene.
- Create a feature layer and reference a feature service with a URL or item ID.
- Add the feature layer to the map or scene.
Map
const trailheadsLayer = new FeatureLayer({
url: "https://services3.arcgis.com/GVgbJbqm8hXASVYi/arcgis/rest/services/Trailheads_styled/FeatureServer/0"
});
map.add(trailheadsLayer);
const trailsLayer = new FeatureLayer({
url: "https://services3.arcgis.com/GVgbJbqm8hXASVYi/arcgis/rest/services/Trails_styled/FeatureServer/0"
});
map.add(trailsLayer,0);
const parksLayer = new FeatureLayer({
url: "https://services3.arcgis.com/GVgbJbqm8hXASVYi/arcgis/rest/services/Parks_and_Open_Space_styled/FeatureServer/0"
});
map.add(parksLayer,0);
Scene
const trailheadsLayer = new FeatureLayer({
url: "https://services3.arcgis.com/GVgbJbqm8hXASVYi/arcgis/rest/services/Trailheads_styled/FeatureServer/0"
});
scene.add(trailheadsLayer);
const trailsLayer = new FeatureLayer({
url: "https://services3.arcgis.com/GVgbJbqm8hXASVYi/arcgis/rest/services/Trails_styled/FeatureServer/0"
});
scene.add(trailsLayer,0);
const parksLayer = new FeatureLayer({
url: "https://services3.arcgis.com/GVgbJbqm8hXASVYi/arcgis/rest/services/Parks_and_Open_Space_styled/FeatureServer/0"
});
scene.add(parksLayer,0);
Display tile data from a vector tile service
This example uses a vector tile layer to access and display data from a vector tile service. The layer works with the service to access the tile data as well as the styles for the data. The styles can also be overridden on the client to change how the layer is displayed in a map or scene.
Steps
- Create a map or scene.
- Create a vector tile layer and reference a vector tile service with a URL or item ID.
- Add the layer to the map or scene.
esriConfig.apiKey = "YOUR_ACCESS_TOKEN";
const vtlLayer = new VectorTileLayer({
url: "https://vectortileservices3.arcgis.com/GVgbJbqm8hXASVYi/arcgis/rest/services/Santa_Monica_Mountains_Parcels_Styled/VectorTileServer/resources/styles/root.json",
opacity: 0.75
});
const map = new Map({
basemap: "arcgis/light-gray",
layers: [vtlLayer]
});
Display data from a GeoJSON file
This example uses a GeoJSON layer to access and display data in a GeoJSON file. The file contains features with a geometry (point, line, or polygon) and attributes. When features are loaded by the layer, they can be styled and the data can be accessed like features in feature layers.
Steps
- Get the URL to the hosted GeoJSON data file.
- Create the layer and set the URL.
- Add the layer to a map or scene.
const geojsonLayer = new GeoJSONLayer({
url: "https://earthquake.usgs.gov/earthquakes/feed/v1.0/summary/all_month.geojson",
copyright: "USGS Earthquakes"
});
esriConfig.apiKey = "YOUR_ACCESS_TOKEN";
const map = new Map({
basemap: "arcgis/light-gray",
layers: [geojsonLayer]
});
Display data from a WMS service
This example uses a WMS layer to display data from an OpenGIS® Web Map Service Interface Standard (WMS) service. The layer displays geo-registered map images from one or more distributed geospatial databases. For more information about this service and specification, visit OGC WMS.
Steps
- Get the URL to the WMS service.
- Create the layer and set the URL. Define which sublayers to display.
- Add the layer to a map or scene as a basemap or data layer.
const layer = new WMSLayer({
url: "https://ows.terrestris.de/osm/service",
sublayers: [
{
name: "OSM-WMS" //OpenStreetMap WMS by terrestris GmbH and Co. KG.
}
]
});
const map = new Map({
basemap: {
baseLayers: [layer]
}
});
Tutorials

Display a popup
Format a popup to show attributes in a feature layer.