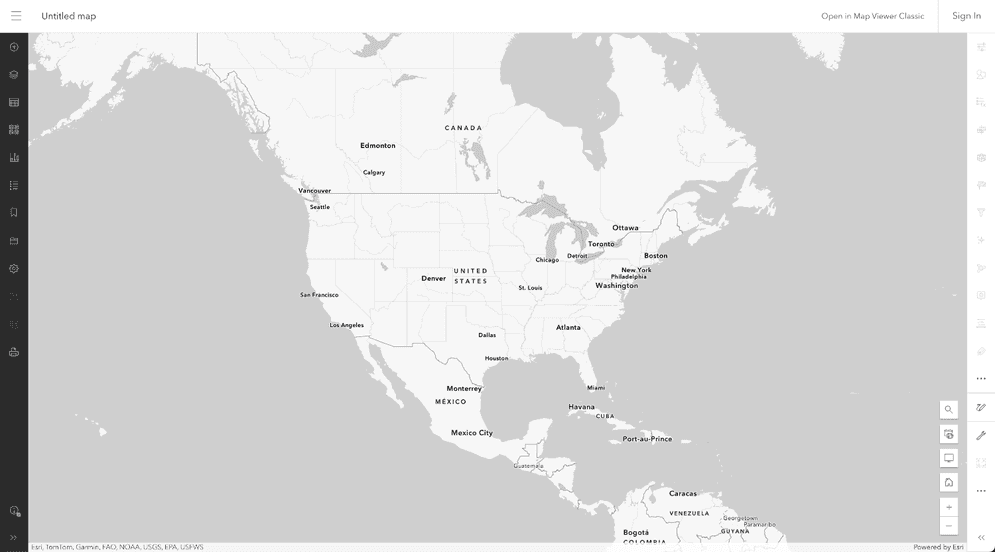
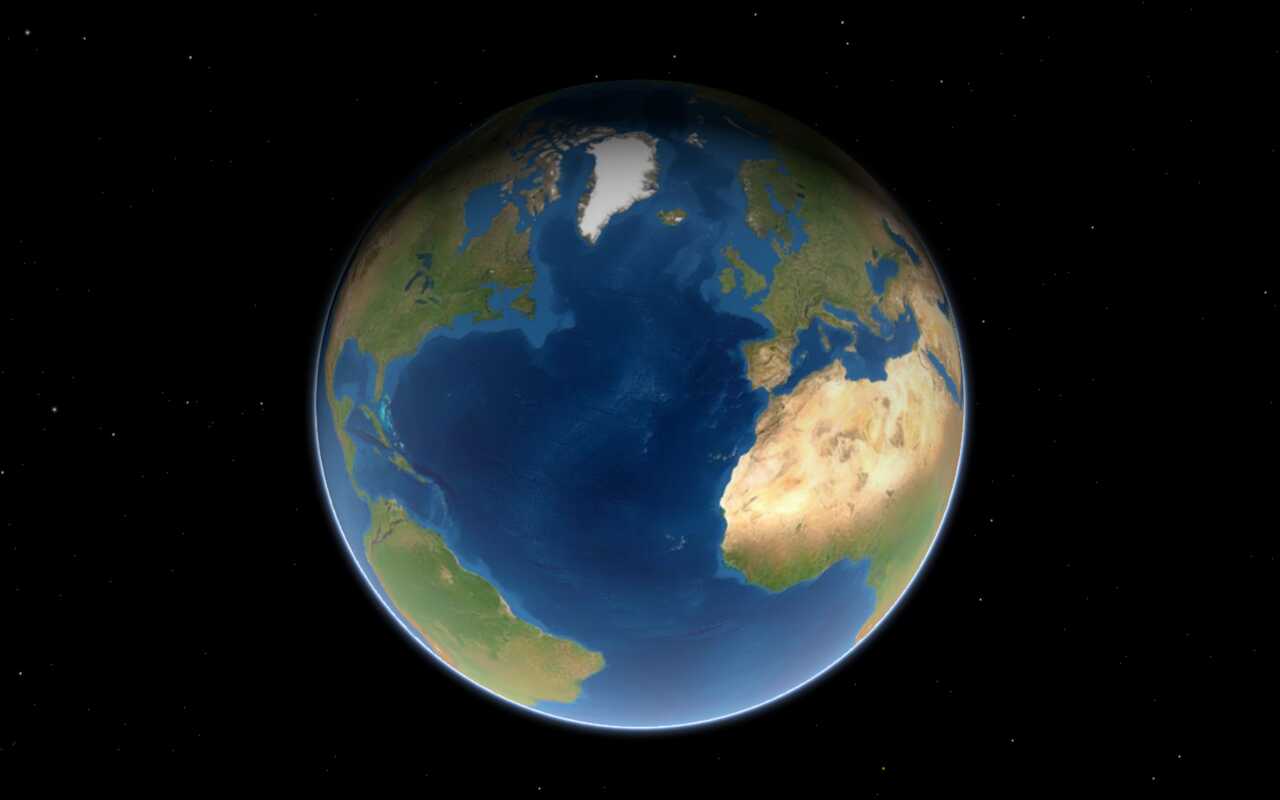
1. Create a map
The first step is to create a 2D map or 3D scene. You can create a map with code or create a web map or web scene interactively with tools such as Map Viewer, Scene Viewer, or ArcGIS Pro.
Create a map with code:
- Reference a client-side mapping library.
- Create a map.
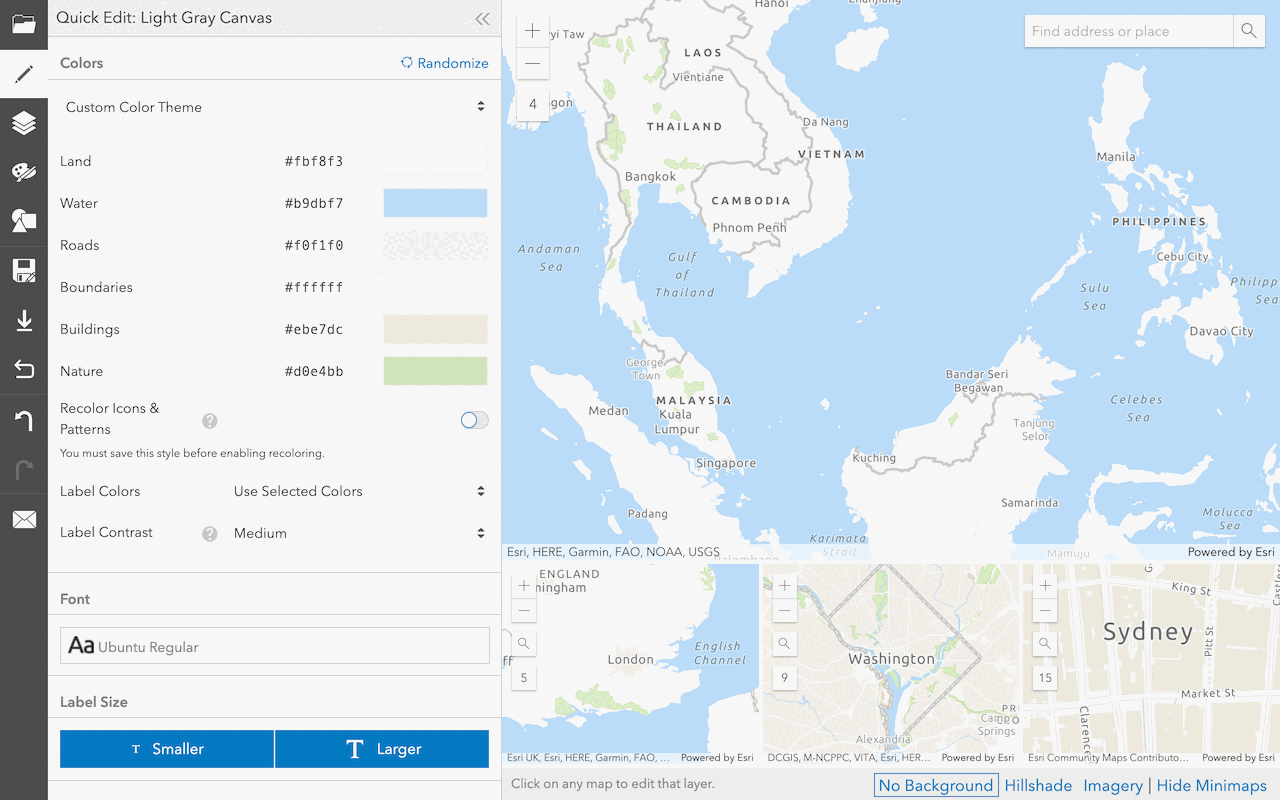
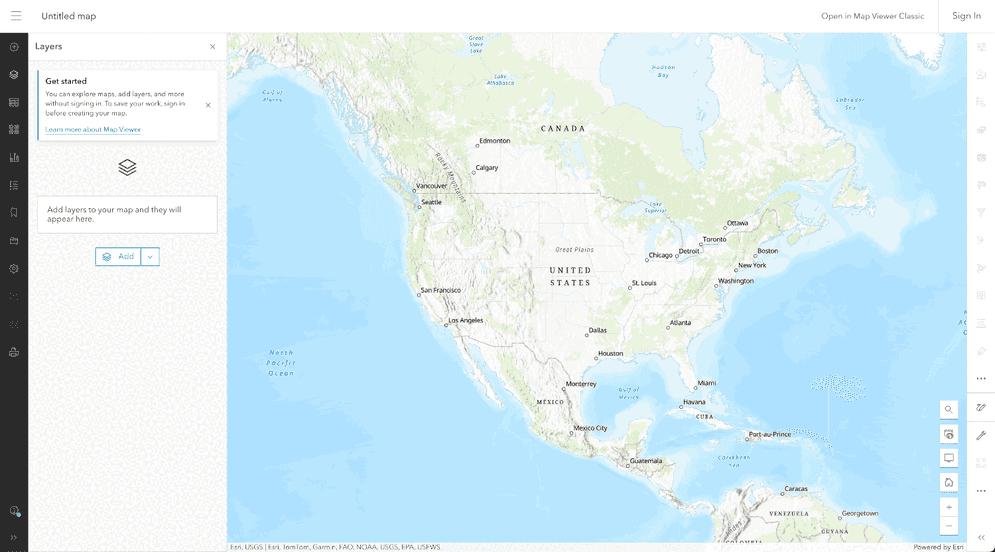
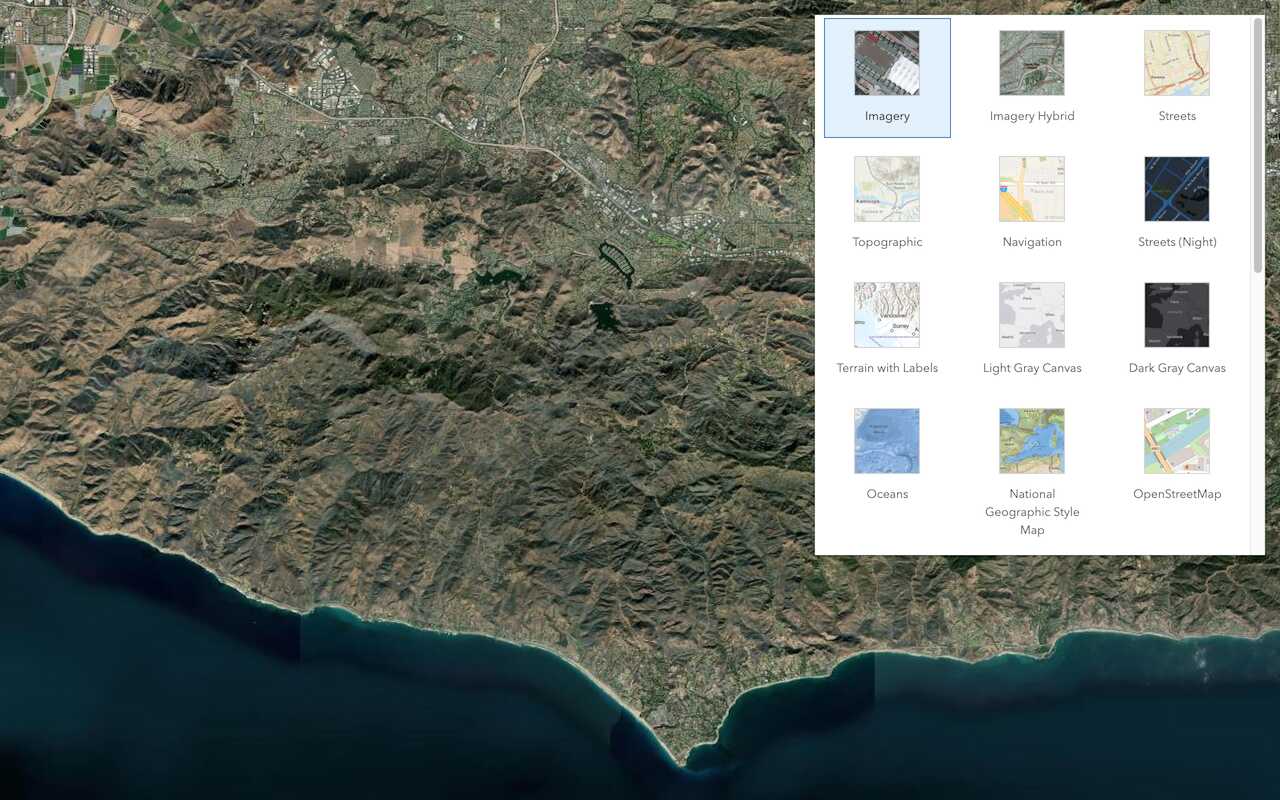
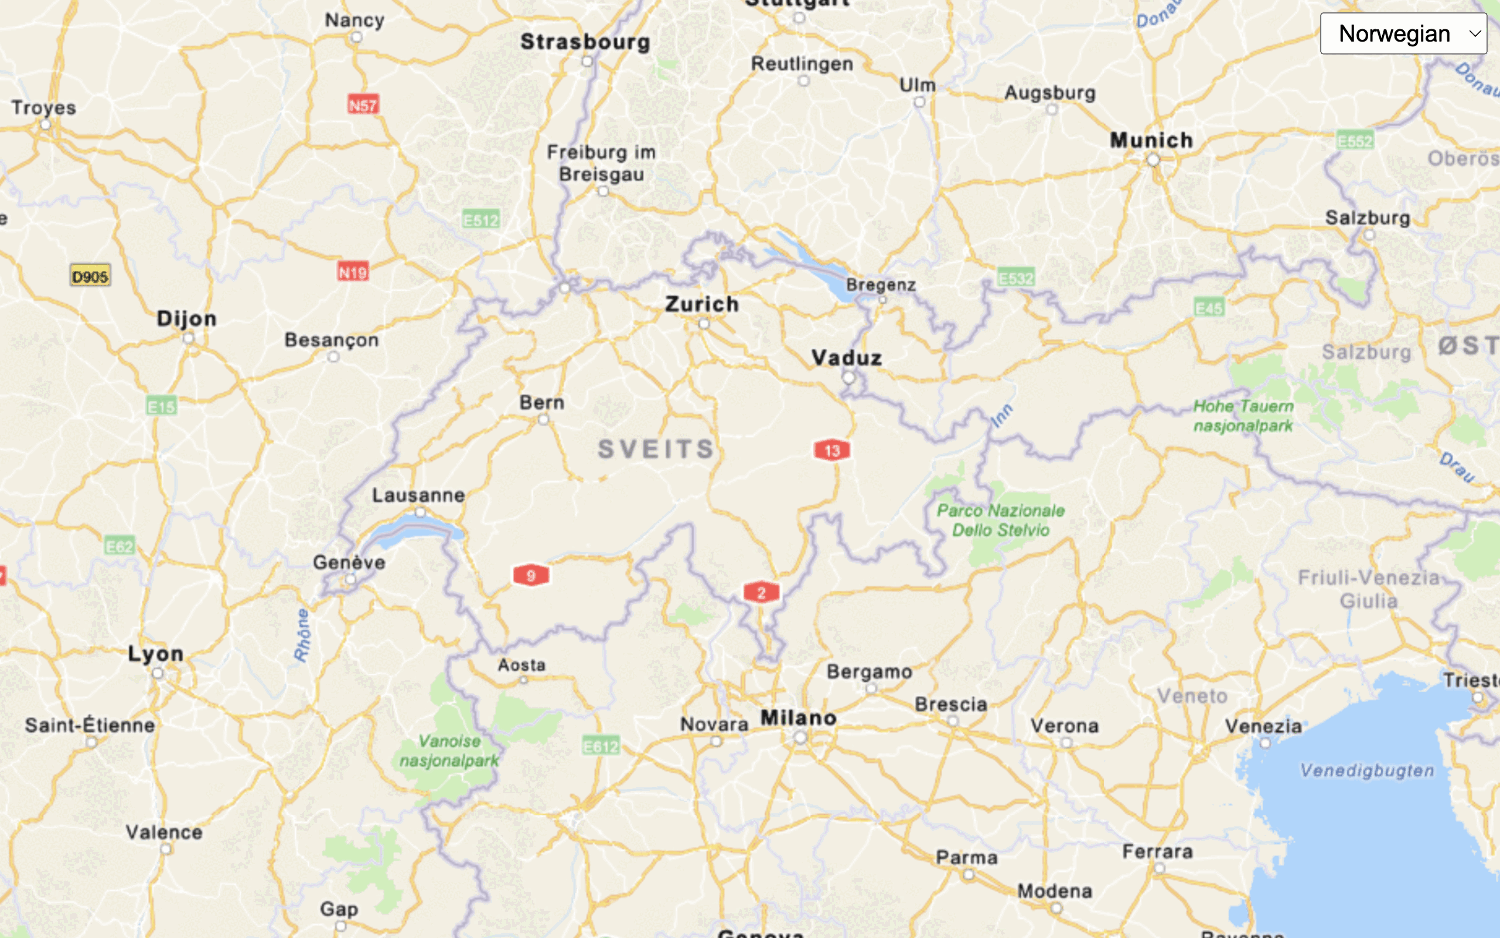
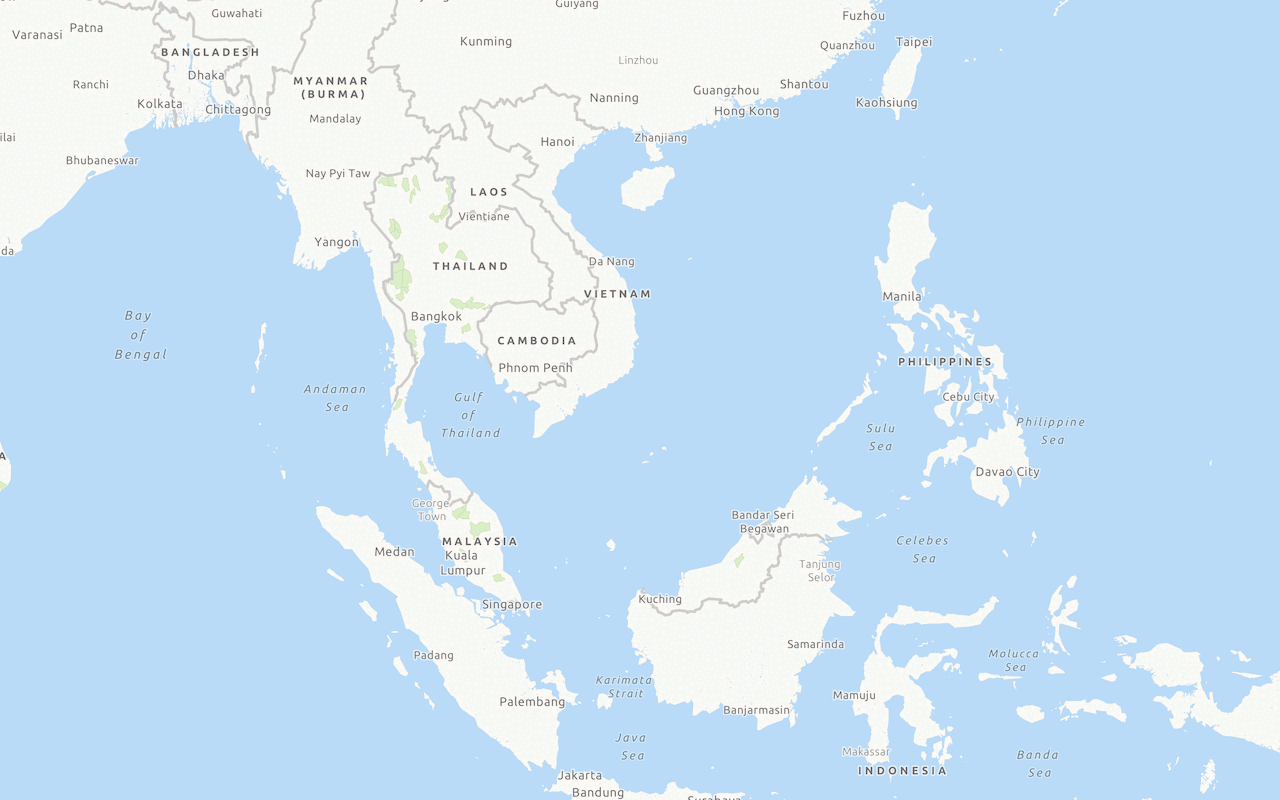
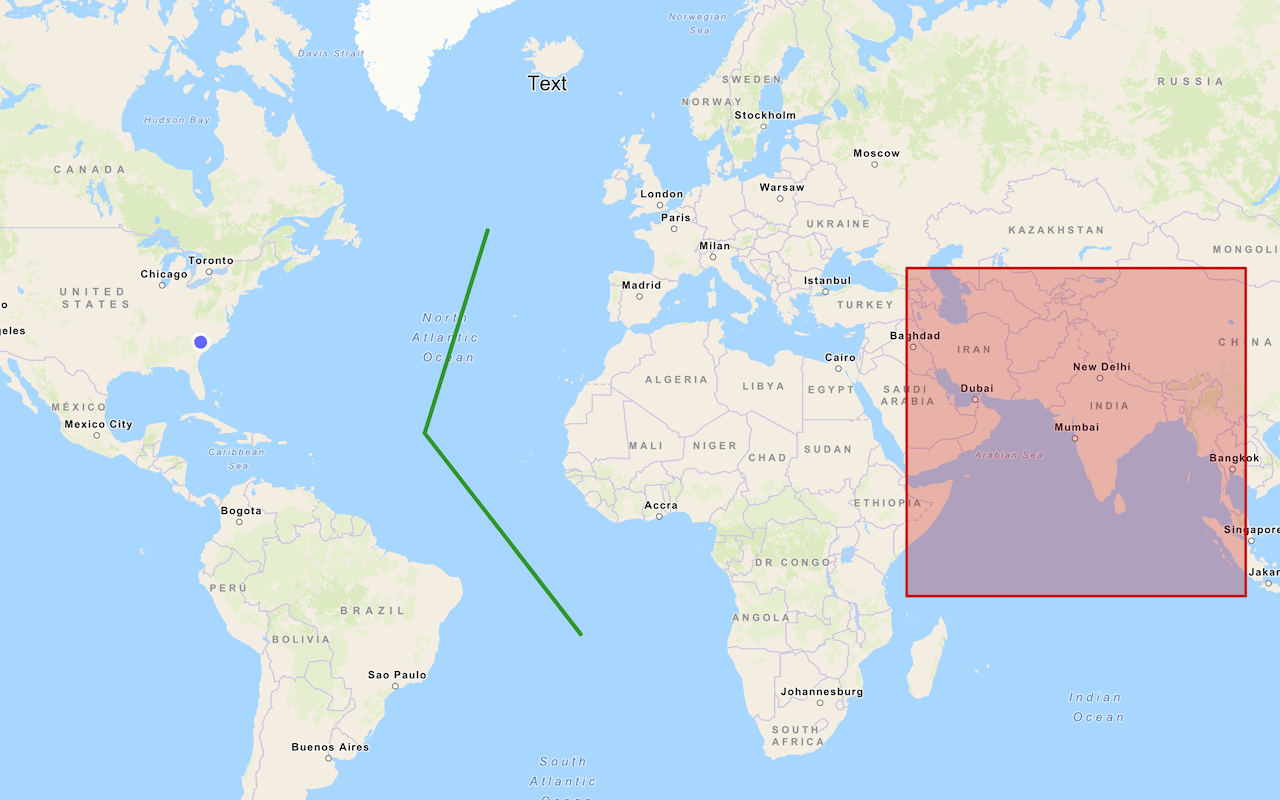
2. Set the basemap
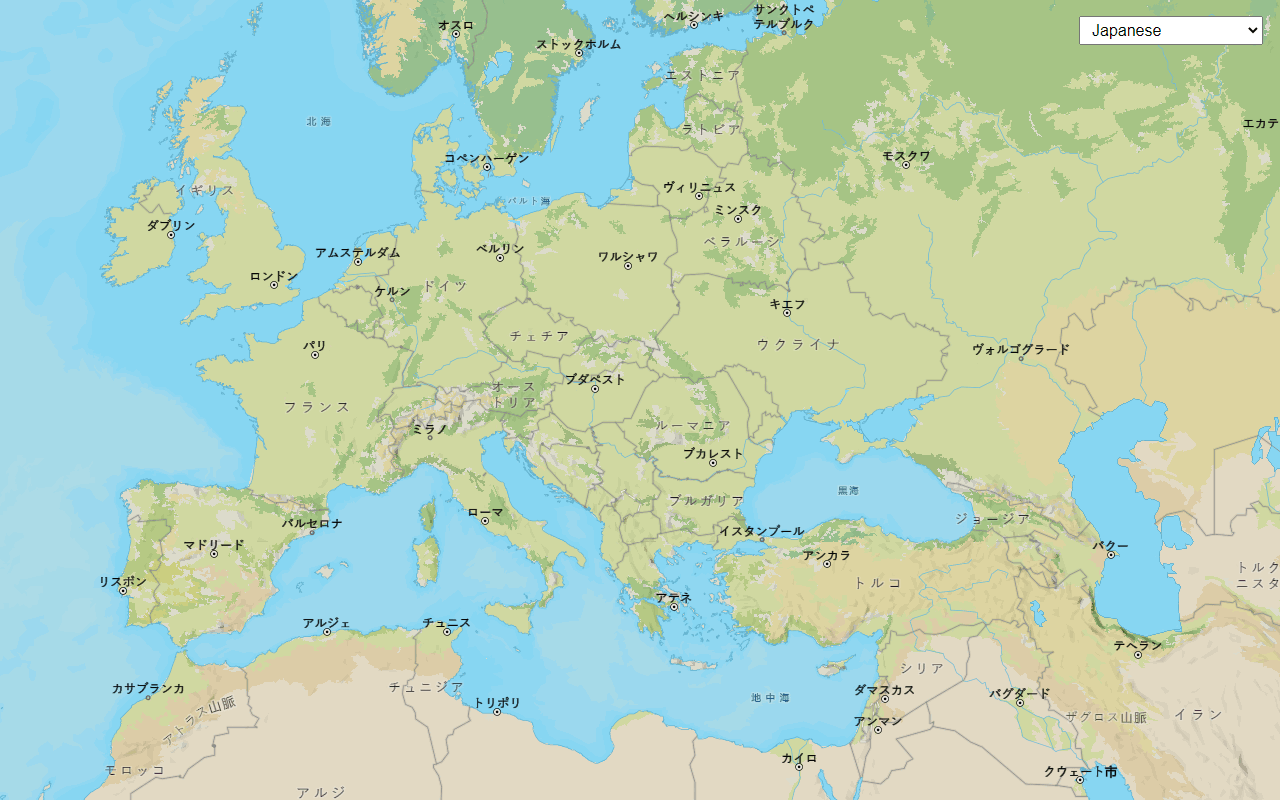
The next step is to define the basemap layer. The most common data source for a basemap layer is the basemap styles service API but you can also use the static basemap tiles service, custom basemap style or data service. The basemap styles service provides many styles you can choose from such as streets, navigation, outdoor, topographic, light gray, and satellite.
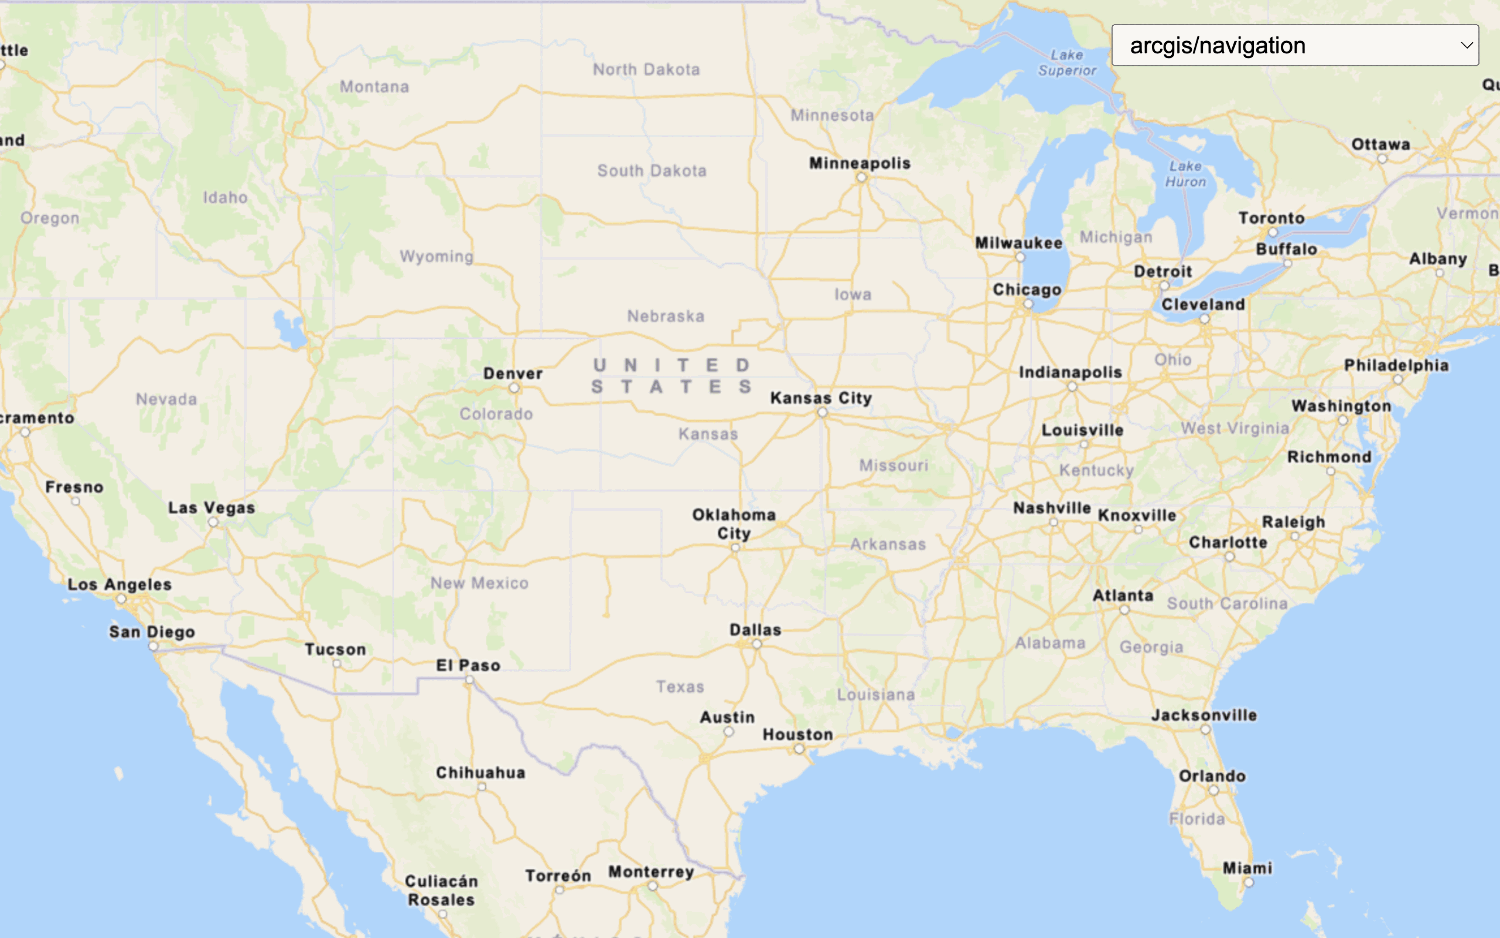
Define the basemap with code:
- Reference the mapping library.
- Create a map.
- Set the basemap source and style.
Example:
esriConfig.apiKey = "YOUR_ACCESS_TOKEN";
const map = new Map();
map.basemap = "arcgis/navigation";
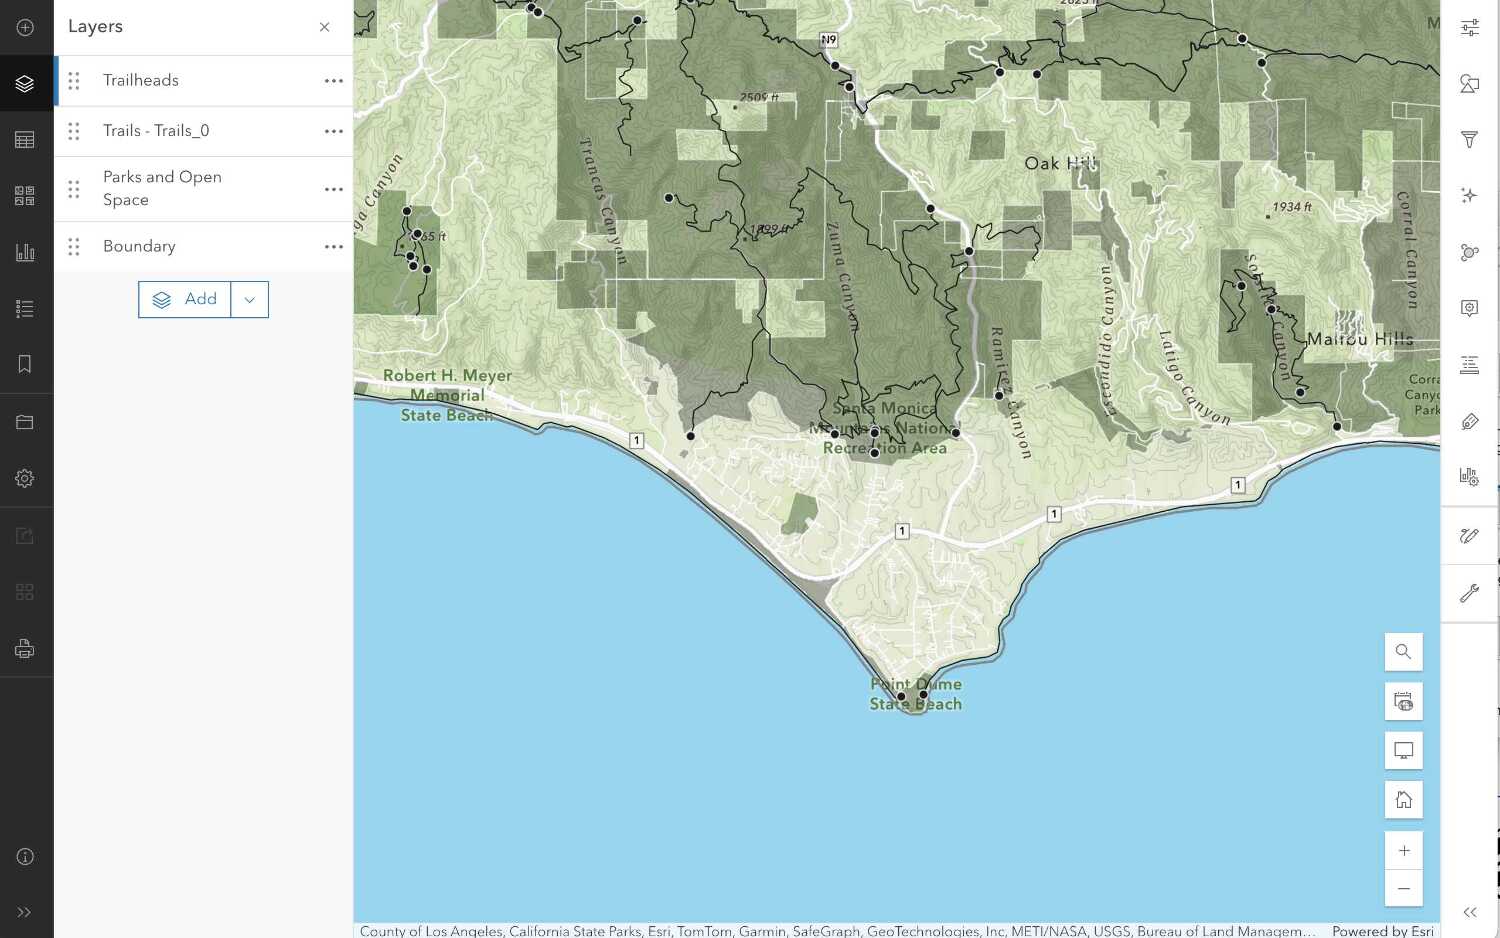
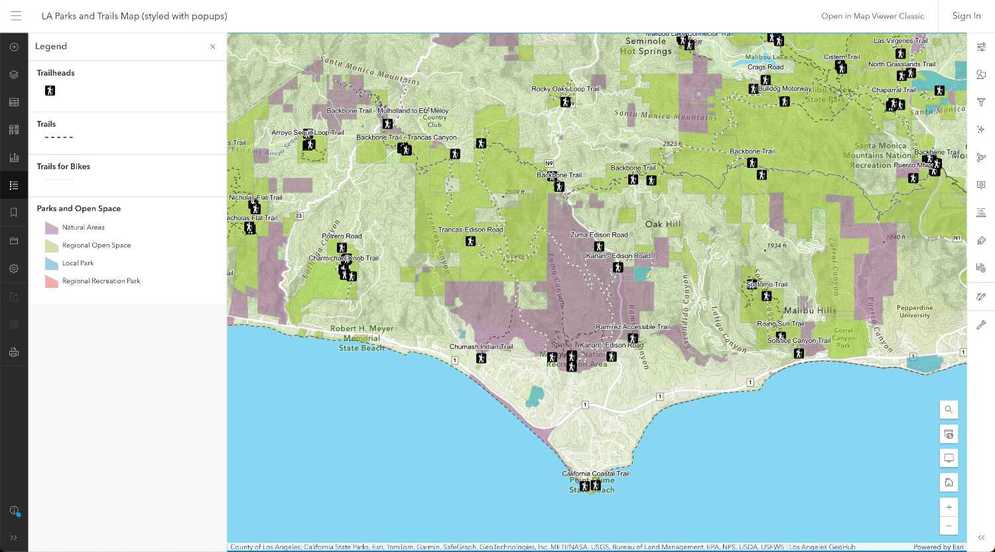
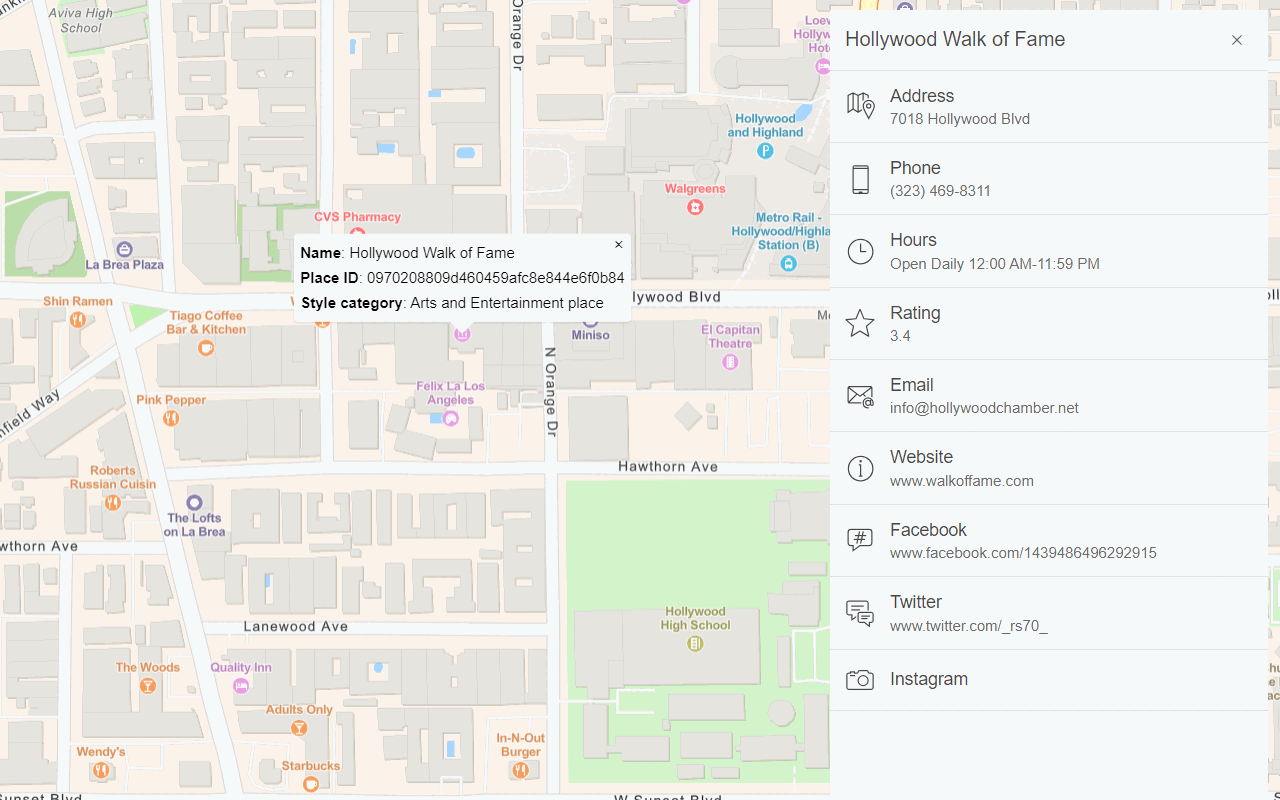
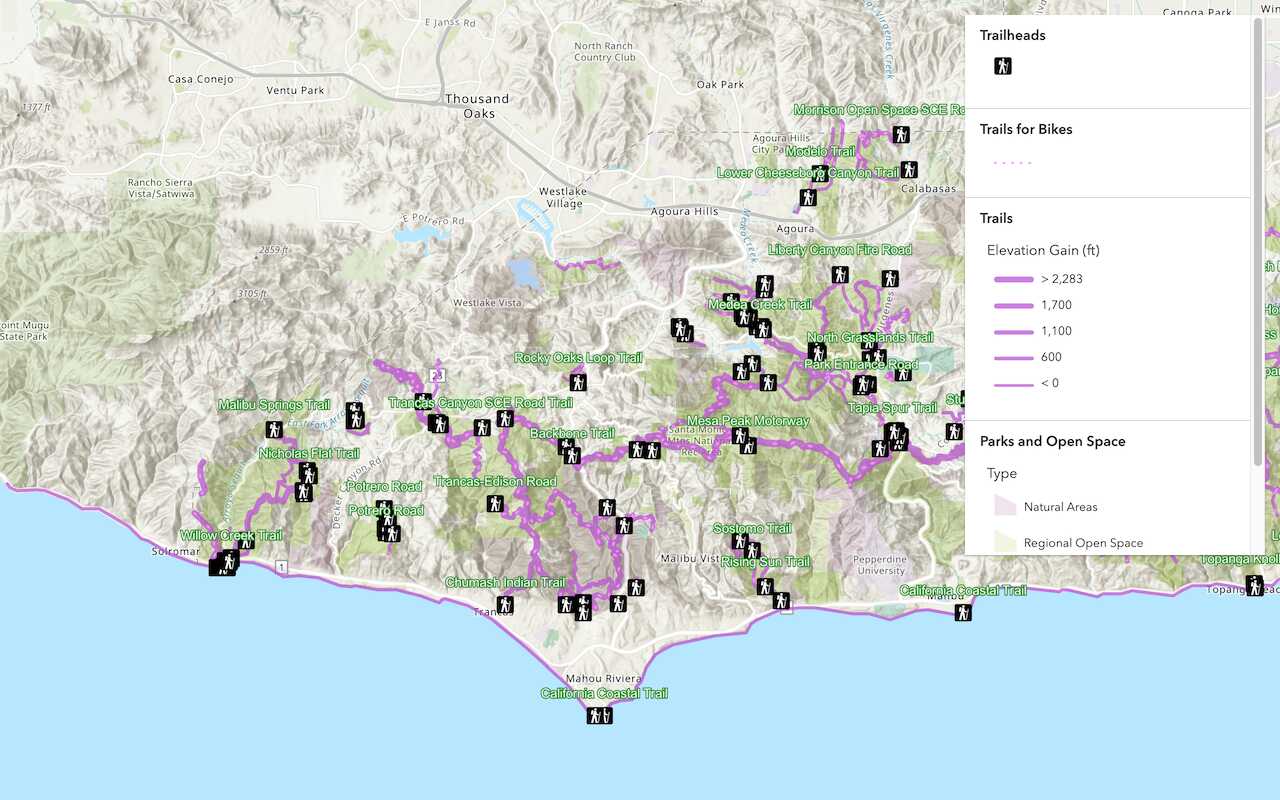
3. Add data layers
After you define a basemap layer, you can add data to a map by adding data layers. A data layer is used to access and display data in data service such as a feature service, vector tile service, map tile service, or image service. The services are typically accessed by their URL or item ID in a portal. Data layers are also used to apply different styles and renderers to features through data visualization.
Define and add the data layers with code:
- Reference the mapping library.
- Create a map.
- Set the service URL or item ID for each data layer.
- Add each data layer.
Example
const trailheadsLayer = new FeatureLayer({
url: "https://services3.arcgis.com/GVgbJbqm8hXASVYi/arcgis/rest/services/Trailheads_styled/FeatureServer/0"
});
map.add(trailheadsLayer);
const trailsLayer = new FeatureLayer({
url: "https://services3.arcgis.com/GVgbJbqm8hXASVYi/arcgis/rest/services/Trails_styled/FeatureServer/0"
});
map.add(trailsLayer,0);
const parksLayer = new FeatureLayer({
url: "https://services3.arcgis.com/GVgbJbqm8hXASVYi/arcgis/rest/services/Parks_and_Open_Space_styled/FeatureServer/0"
});
map.add(parksLayer,0);
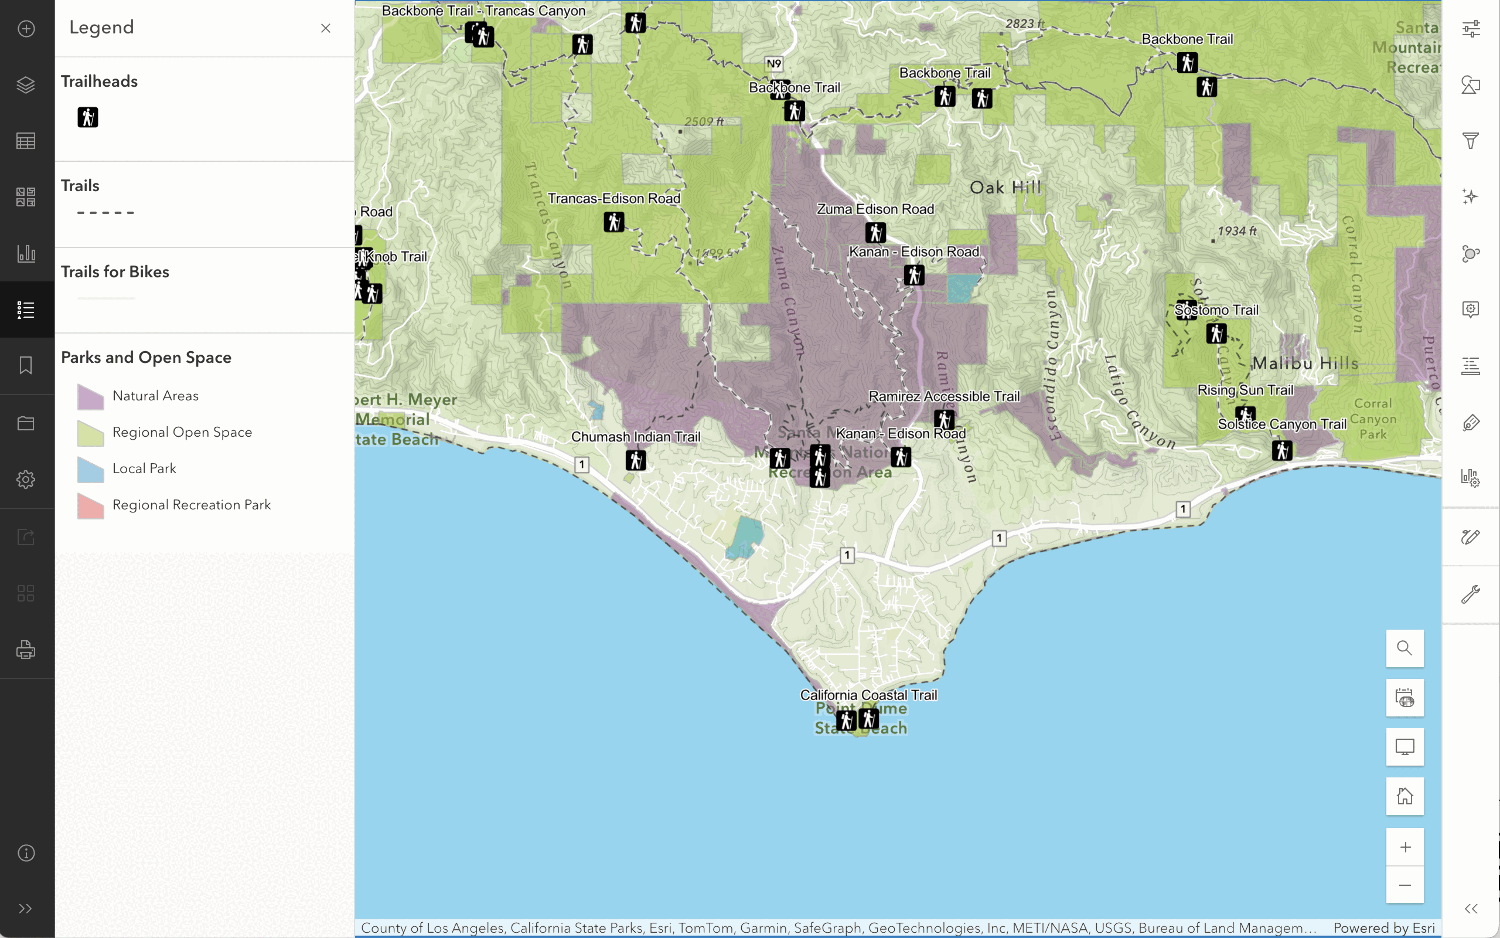
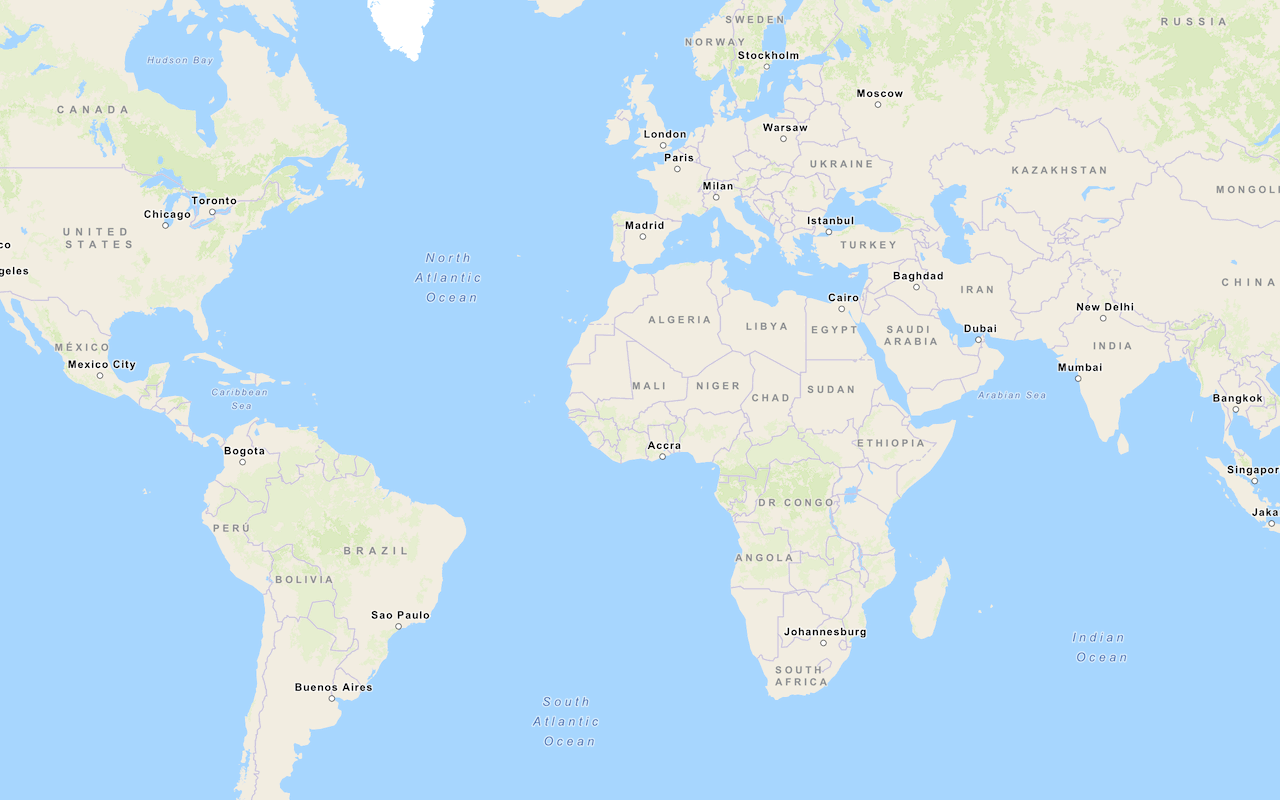
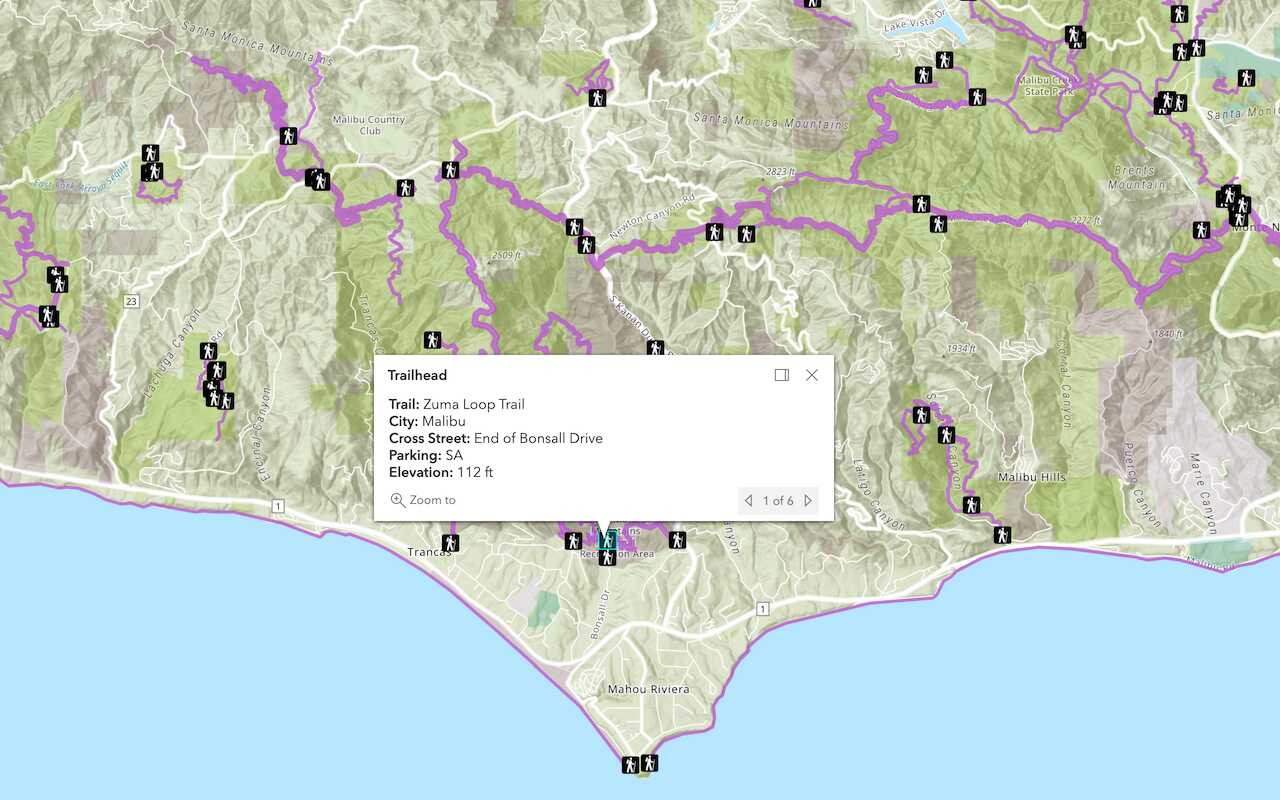
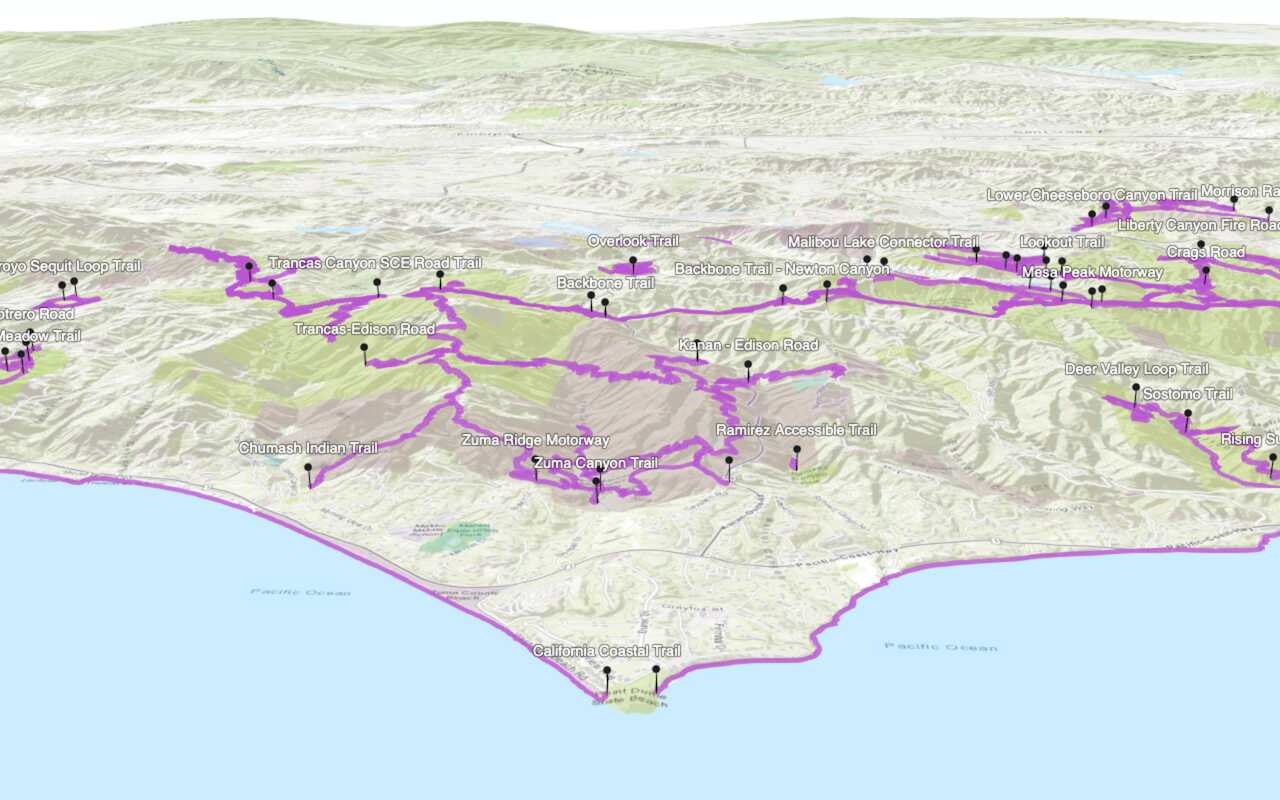
4. Display the map
The final step is to display the basemap layer and data layers on a map. Depending on the client-side mapping library you are using, you can use a view to display the data in 2D as a map or 3D as a scene. You also need to set the location and zoom level or scale of the view.
Display the map using a view:
- Reference the mapping library.
- Create a map.
- Set the service URL or item ID for each data layer.
- Add each data layer.
- Set the map location.
- Set the zoom level or scale.
- Display the map.
const view = new MapView({
map: map,
center: [-118.805, 34.027], // Longitude, latitude
zoom: 13, // scale: 72223.819286
container: "viewDiv",
constraints: {
snapToZoom: false
}
});Additional resources
Tutorials
APIs
Display a map
Create and display a map with the basemap styles service.
Tools