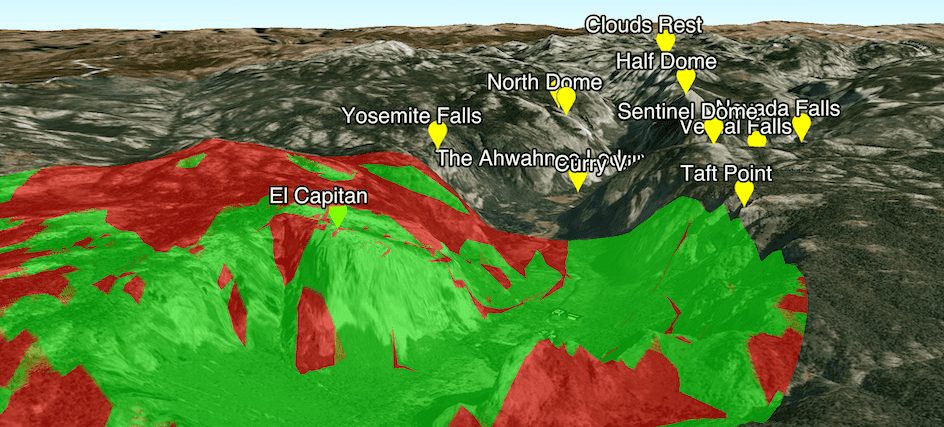
A viewshed analysis indicating the visibility of parts of Yosemite Valley from the summit of El Capitan.
What is viewshed analysis?
A viewshed analysis is type of visibility analysis that calculates and displays the visibility (either visible or obstructed) of 3D elements in a scene from an observer's perspective. A viewshed is calculated from an observer point, which can be a point location, a camera, or a geoelement. You may also provide additional properties such as heading and pitch to set the exact perspective of the observer.
The result of viewshed analysis is a viewshed layer that represents what can be seen from the observer's point. Within the specified area, portions of the scene are visible to the observer with a color indicating visibility (the default is green). Portions not visible to the observer display in a color indicating that the view is obstructed (the default is red).
Viewshed analysis has practical applications in urban planning, military science, and many other fields.
A popular use of viewshed analysis is to determine the optimal placement of towers. Companies perform viewshed analysis when planning the location of new cell towers in order to maximize their service coverage. Additionally, the United States Forest Service previously performed viewshed analysis when planning the locations of fire observation towers, though the use of such towers has since been discontinued.
Other real-world use cases for viewshed analysis include the following:
- Maximizing visibility of a new public park or monument.
- Minimizing visibility of landfills, parking lots, and oil rigs.
- Planning the route of hiking trails to create scenic views.
Types of viewshed operations
| Operation | Description | Example |
|---|---|---|
Location | Performs viewshed analysis from a point location anywhere in space. |
|
Location | Performs viewshed analysis from the perspective of a Camera. |
|
Geo | Performs viewshed analysis from a GeoElement in a scene. |
|
How to perform a viewshed analysis
Client-side viewshed analysis can be performed using the ArcGIS Maps SDKs for Native Apps or ArcGIS Maps SDKs for JavaScript.
The general steps for performing a viewshed analysis are:
-
Create a scene view and set its extent to the desired location.
-
Create an observer location.
-
Create a
Viewshedfor your type of observer and set the necessary properties. -
Visualize the analysis by adding it the view.
Viewshed observer properties
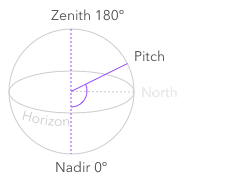
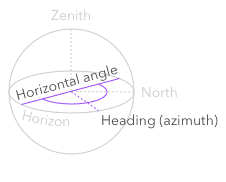
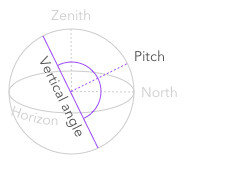
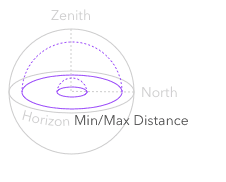
To perform a viewshed analysis, you set several properties that define a perspective and boundaries for the operation. These properties describe where the observer is looking in 3D space, the size of their field of view, and the minimum/maximum distance they can see.
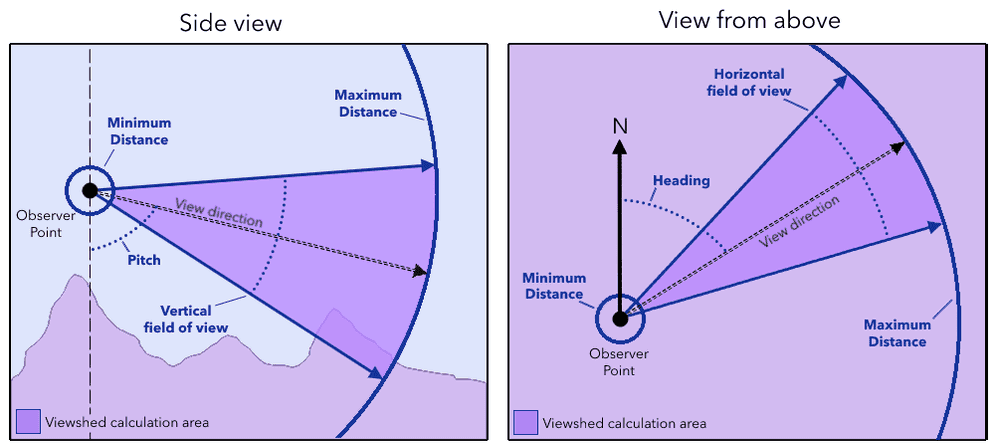
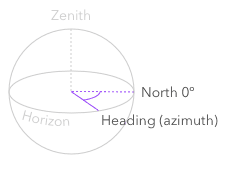
The heading defines the observer's view direction, relative to north. North has a value of 0 (in degrees) and increments upwards as you rotate clockwise.
Code examples
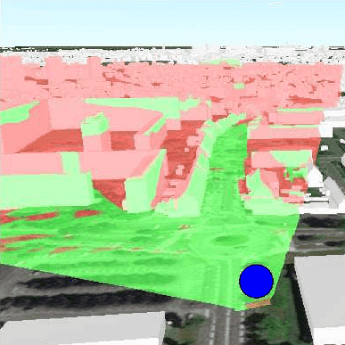
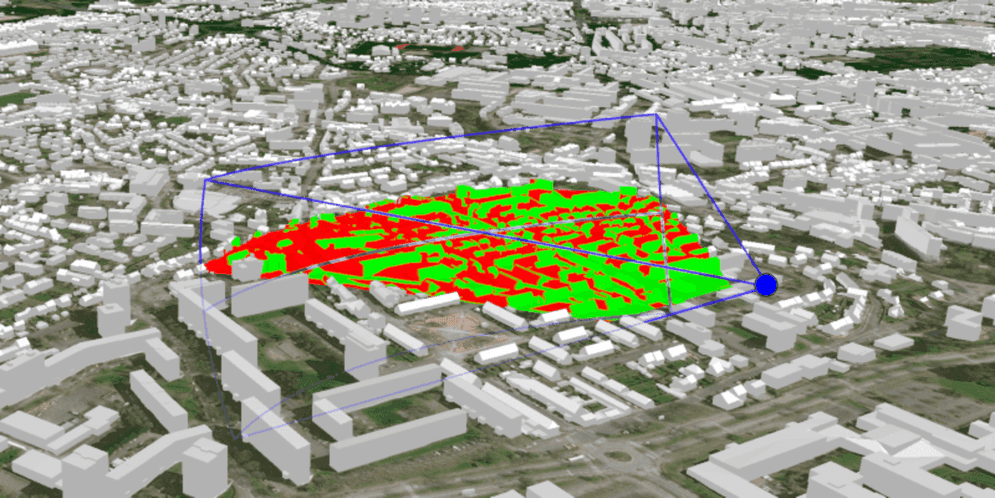
Display a viewshed (Point)
This example performs and displays a viewshed analysis in a scene view from a 3D point location. The observer point and observer perspective are shown in blue. Locations visible from the observer point are displayed in green, while obstructed areas are displayed in red.
const viewshed = new Viewshed({
observer: location,
heading: 0,
tilt: 90,
horizontalFieldOfView: 360,
verticalFieldOfView: 180,
farDistance: 500
});
const viewshedAnalysis = new ViewshedAnalysis({ viewsheds: [viewshed] });
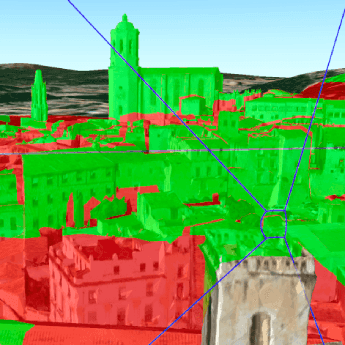
view.analyses.add(viewshedAnalysis);Display a viewshed (Camera)
This example performs and displays a viewshed analysis in a scene view from the perspective of a camera. Once the viewshed operation is complete, the scene may be panned to view visible and obstructed areas.
private void CreateViewshed(Camera observerCamera)
{
var viewshed = new LocationViewshed(
camera: observerCamera,
minDistance: 10,
maxDistance: 500
);
_analysisOverlay.Analyses.Add(viewshed);
}
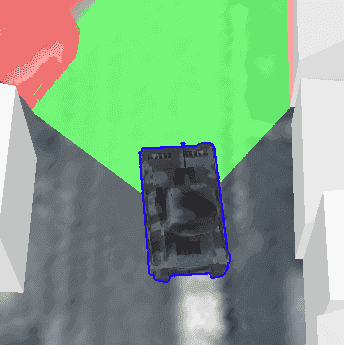
Display a viewshed (GeoElement)
This example performs and displays a viewshed analysis in a scene view from the perspective of a tank geoelement. The viewshed operation dynamically responds when the tank moves to determine the viewpoint of someone driving down the road.
private void CreateViewshed(GeoElement geoElement)
{
var viewshed = new GeoElementViewshed(
geoElement: geoElement,
horizontalAngle: 90,
verticalAngle: 40,
minDistance: 1,
maxDistance: 250,
headingOffset: 0,
pitchOffset: 0
);
_analysisOverlay.Analyses.Add(viewshed);
}