1. Choose function(s)
The first step in performing an analysis is to select one or more functions that you can chain together to perform the analysis.
Click on the table below to learn more about the functions in each group.
| Group | Use case |
|---|---|
| Analysis | Perofrm spatial analysis operations such as change detection, vegetation indices (NDVI), kernal density, weighted overlay, and more. |
| Appearance | Adjust the visual appearance of raster data such as contrast, brightness, sharpening, pansharpening, and applying color maps or stretches. |
| Classification | Classify data into categories based on techniques such as maximum likelihood, region growing, and mean shift segmentation. |
| Conversion | Convert raster data between different color models (RGB, HSV), rasterize features or attributes, compute complex values from rasters, and convert between single-band and multi-band rasters. |
| Correction | Perform radiometric and atmospheric corrections on satellite/aerial imagery, adjusting for factors like solar illumination angles, topographic effects, cloud/shadow masking, and atmospheric interference to retrieve accurate surface reflectance values. |
| Data management | Manage and prepare raster data, such as reprojecting, resampling, mosaicking, rasterizing features or attributes, modifying raster properties like bit depth or NoData values. |
| Distance | Calculate distance metrics like Euclidean, cost, surface, and accumulated distances from while accounting for factors like barriers, surface elevation, and directional cost surfaces. |
| Hydrology | Perform terrain and hydrological analyses on elevation data, such as filling sinks, calculating flow direction, flow accumulation, stream delineation, watershed delineation, and deriving hydrological characteristics like slope, aspect, and curvature. |
| Math | Perform mathematical operations and transformations, such as arithmetic calculations between rasters, trigonometric functions, statistical summaries, and algebraic expressions involving multiple raster bands. |
| Statistical | Compute summary statistics like minimum, maximum, mean, and standard deviation, calculate zonal statistics based on zones defined by another raster or feature class, and derive statistical measures like percentile values or data ranges. |
| Surface | Calculate slope, aspect, curvature, hillshade, viewshed, contours, fill sinks or voids, and derive other topographic parameters using geodesic methods. |
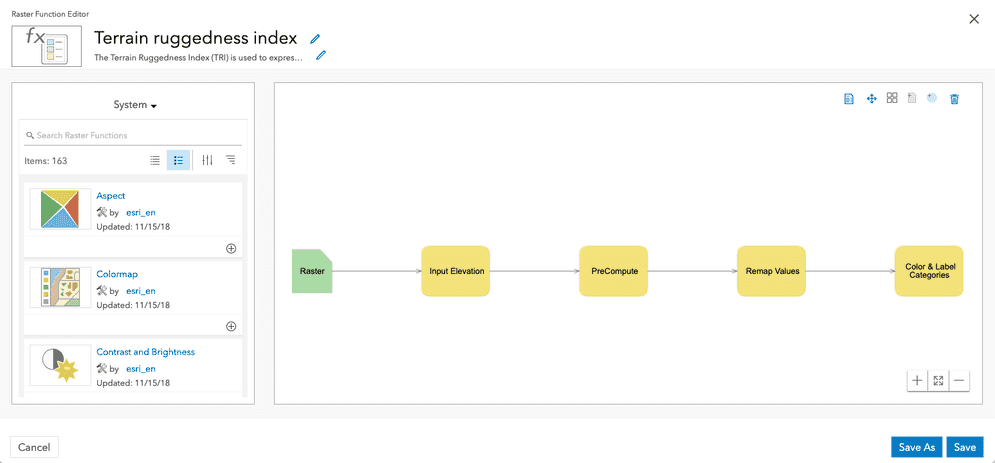
2. Create a raster function template
The easiest way to use raster functions is to use the function editor tool. The raster function editor is a visual programming interface that allows you to build and automate raster analysis workflows. It provides a gallery of functions that can be chained together into raster function templates (RFTs). The editor represents the analysis as a diagram, where individual functions are connected in sequence. The output of one function is used as the intput to the next. You can insert raster datasets, constants, variables, and Python functions into the diagram to construct the desired processing chain. Raster function templates can be saved, shared and applied to different to input data to automate the analysis process.
The general process to create a raster function template is as follows:
- Sign in to your portal using an ArcGIS Online or ArcGIS Enterprise account.
- In your portal, click Content > My content > New item.
- In the New item dialog select Raster function template.
- Fill out the
title,folder,tags, andsummaryfilds. - Click yes to open the "Raster function editor" after the item is created.
- Add the functions needed to perform the desired analysis.
- click Save.
A new item will be created in your portal.
To learn more, go to Raster Function Editor
3. Perform the analysis
You can use tools and APIs to perform an analysis using the item you created above. Regardless of the method you use, they all require user authentication to make requests to the raster analysis service and the transactions need to managed as job requests (long transactions).
The easiest way to programmatically perform an analysis with functions is to use client APIs. These APIs provide authentication classes and simplify the process of making and managing job requests.
The general steps to perform analysis with a raster function template are:
- Import the appropriate libraries.
- Get the raster analysis service URL from your portal.
- Identify the required input for the analysis.
- Set the input parameters and make the request
- Check the job status and display the results.
const job = await EsriGeoprocessor.submitJob(analysisURL, jobParams)
const res = await job.waitForJobCompletion({
interval:5000,
statusCallback: (j)=>{console.log(`Job status: ${j.jobStatus}`)}
})
if (res.jobStatus === "job-succeeded"){
const r = await res.fetchResultData("outputRaster")
const resultLayer = new EsriImageryTileLayer({portalItem: {id: r.value.itemId}})
map.add(resultLayer)
}