Learn how to perform a raster analysis with raster functions.
In this tutorial, you use tools to build a raster function template to generate a Terrain Ruggedness Index for an area around Santa Monica, CA. A Terrain Ruggedness Index or TRI calculates the difference in elevation between the cells of a DEM. You can perform the analyses either in Map Viewer or programmatically using the ArcGIS Python, ArcGIS REST JS, and ArcGIS REST APIs.
The analysis includes:
- Creating a new raster function template item.
- Adding and connecting built-in raster functions.
- Perform the analysis by running the created template in the Map Viewer.
- Visualize the analysis results in a map.
The functions used in the raster template are:
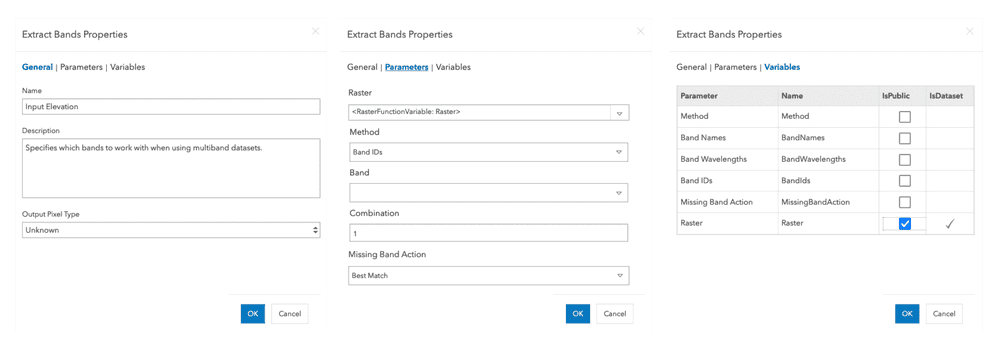
- Extract Bands
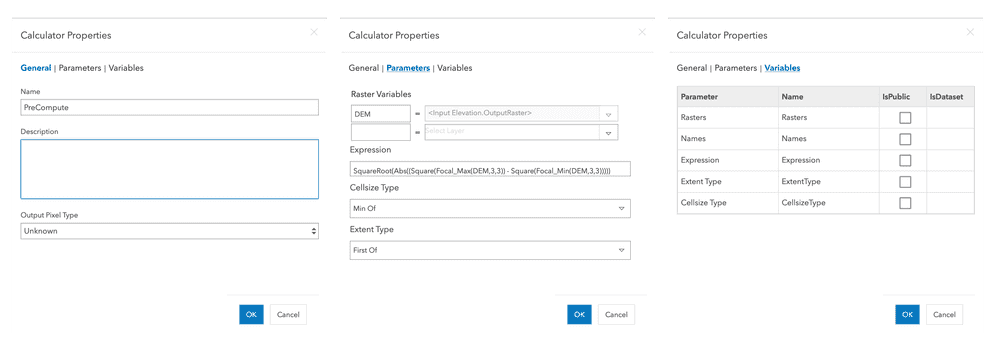
- Calculator
- Remap Properties
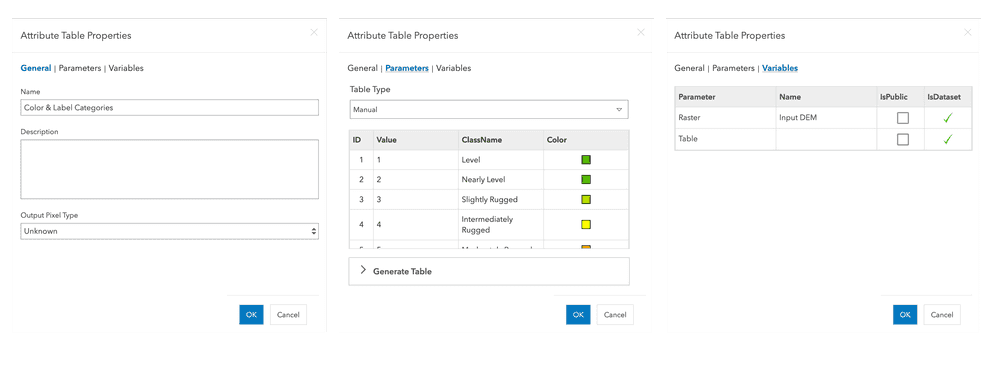
- Attribute Table
Prerequisites
Steps
Create a raster function template
-
In a web browser, Sign in to your portal with your ArcGIS account.
-
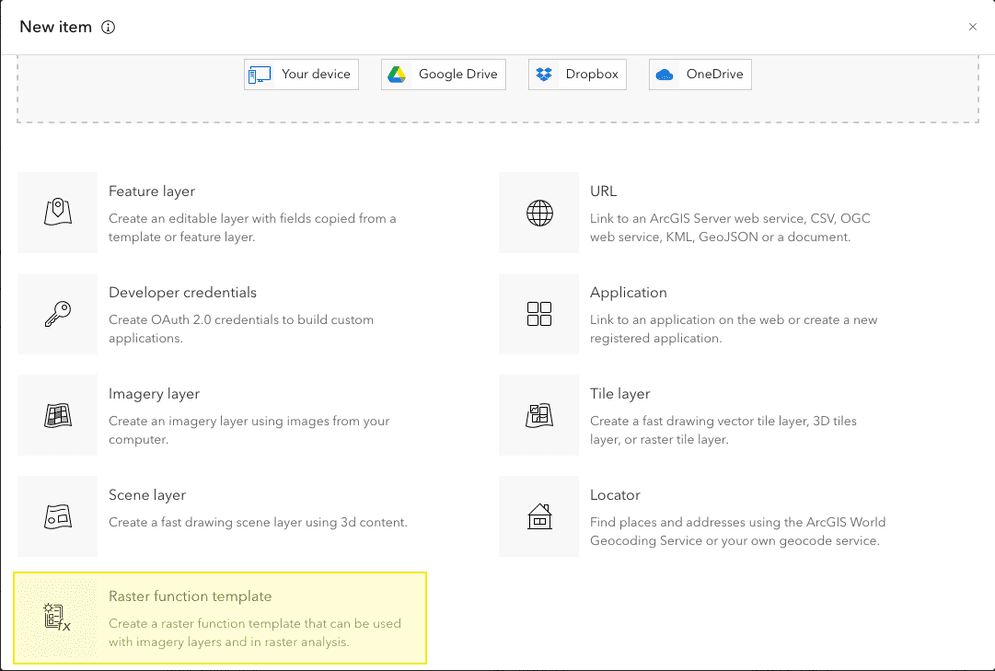
On the main menu, click Content. Then click the New Item button.
-
In the New item dialog select Raster function template.
-
Fill out the following fields:
- Title:
Santa Monica - Terrain ruggedness index - Tags:
raster, analysis, function, template, santa monica, tutorial - Summary:
The Terrain Ruggedness Index (TR I) is used to express the amount of elevation difference between adjacent cells of a DE M.
- Title:
-
Click Save, then click Yes in the popup to open the template item in the Raster Function Editor.
-
You will be presented with a blank function template diagram in the Raster Function Editor tool window.
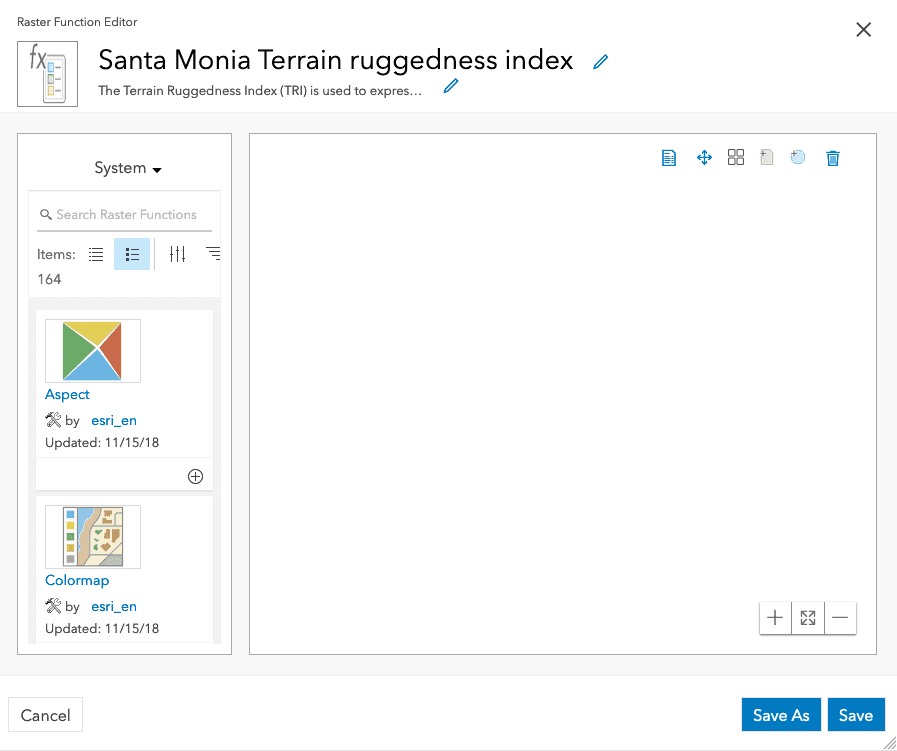
An new item is created in your portal.
Add raster functions
-
In the Raster Function Editor, from the tools in the top right corner, click Add Raster Variable.
-
Search for the built in Extract Bands function in the left side bar, and click the Add Function Button. The Extract Bands function will be added to your diagram.
-
To connect the variable as input to the Extract Bands function. Drag a line from the Raster Variable to the new Extract Bands function.
-
Double click the Extract Bands function to open the function properties dialog. Click through each of the tabs and fill out the properties to match below:
-
Add the Calculator function to your diagram and connect the output of the Extract Bands function as an input to the Calculator function.
-
Open the properties of the Calculator function, Click the parameters tab and enter the following values:
- Raster Variables :
DEM - Expression:
SquareRoot( Abs(( Square( Focal _Max( DE M,3,3)) - Square( Focal _Min( DE M,3,3))))) - CellSize Type:
Min Of - Extent Type:
First Of
- Raster Variables :
-
Add the Remap function to your diagram and connect the output of the Calculator function as an input to the Remap function.
-
Open the properties of the Remap function, Click the parameters tab and enter the following values:
ID Minimum Maximum Output 1 0 80 1 2 81 116 2 3 117 161 3 4 162 239 4 5 240 497 5 6 498 958 6 7 959 5000 7 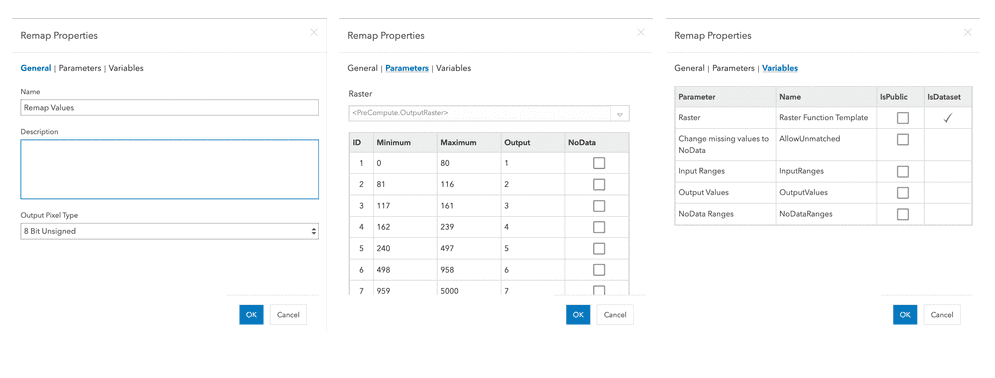
-
Add the Attribute Table function to the diagram and connect the output of the Remap Function as the input to the Attribute Table function.
-
Open the properties of the Attribute Table function, click the parameters tab and enter the following values:
- Table Type:
ManualID Value ClassName Color 1 1 Level #3AA900 2 2 Nearly Level #6EC500 3 3 Slightly Rugged #B2E300 4 4 Intermediately Rugged #FFFC00 5 5 Moderately Rugged #FFAA00 6 6 Highly Rugged #FF5200 7 7 Extremely Rugged #ff0100
- Table Type:
-
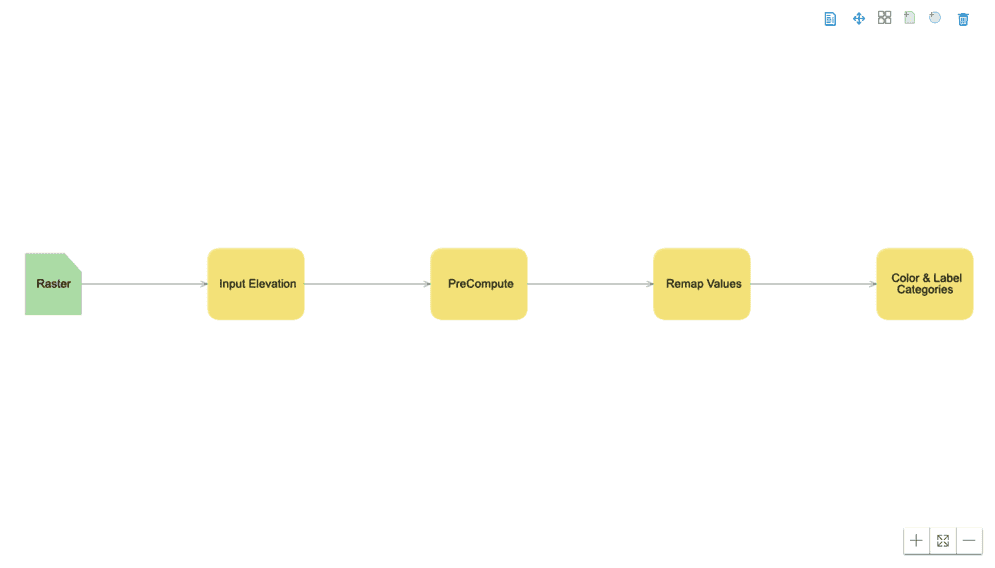
You completed raster function template should should look like this:
-
Click the Save button to persist your edits and close the Raster Function Editor tool.
Perform the analysis
-
On the main menu click Map to open the Map Viewer.
-
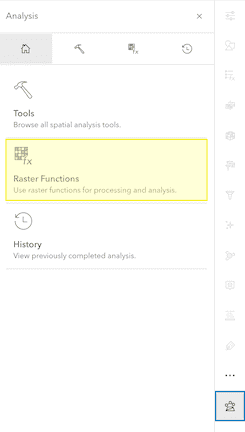
In the right side bar, click the Analysis button to open the Analysis panel. Then click Raster Functions to display the list of built in functions.
-
At the bottom of the function list select Open Raster Function Template from the dropdown. The Browse raster function templates dialog opens.
-
Select My Content from the dropdown and select the
Santa Monica - Terrain ruggedness indextemplate you just created. -
Click the Confirm confirm button at the bottom of the dialog. The template opens as a tool in the Analysis panel.
-
For the input elevation Raster, select Browse layers to open the Select layer dialog.
-
In the dropdown to the left of the search bar, select ArcGIS Online.
-
In the search bar paste in the following Item ID:
c7b1872373474e9086259f5796228921.
This is a predefined elevation layer in our area of interest. If you have your own DEM or elevation layer you can use that.
-
Click the Select Layer button to select the layer then click Confirm and add to map*.
-
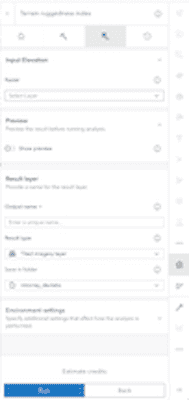
Enter the following values for each parameter under the Result Layer heading:
- Output Name:
Santa Monica TRI Result - Result Type:
Tiled imagery layer
- Output Name:
-
At the bottom of the tool, click Estimate credits to determine the how many credits the analysis will consume.
Using the provided input imagery layer the analysis will consume 1 credit.
-
Click the Run button to start the analysis. After a short period of time an alert should display indicating the analysis has been submitted.
-
Click the History button in the top right of the Analysis pane to view the progress of the analysis.
-
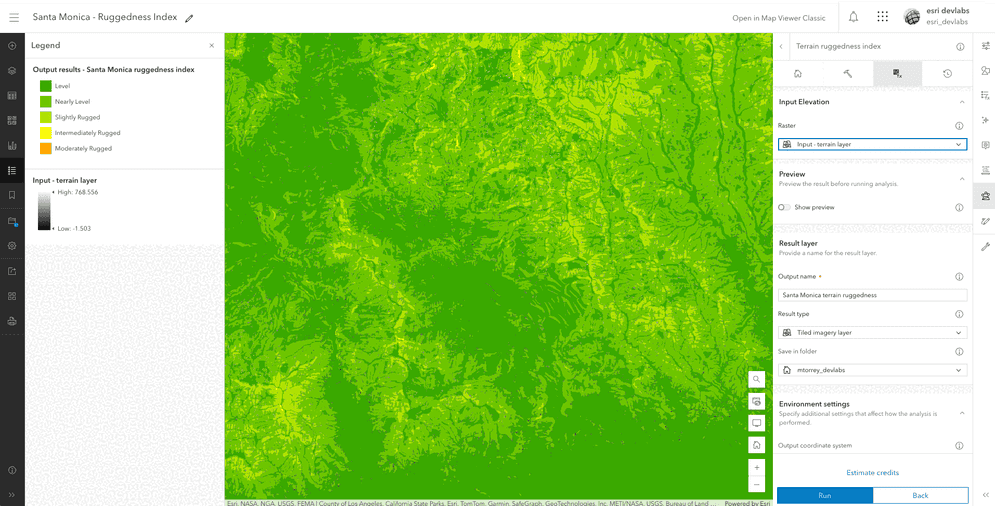
Once the analysis has completed, the result layer will be added to the map.
A new tiled imagery layer will be created in your portal with the analysis result.
APIs
The general steps for performing the analysis programmatically are:
- Implement user authentication to access the raster analysis service.
- Access the raster function template you created in the steps above.
- Access an imagery layer to use as input to the analysis.
- Add input parameters and make the request.
- Handle the results.
# send the request
output_result = generate_raster(
raster_function=rft_json,
function_arguments={"Raster": {"url": dem.url}},
output_name="Santa Monica TRI (python)",
context={
"extent": {
"xmin": -13203076.3188,
"ymin": 4035131.0044,
"xmax": -13193005.7403,
"ymax": 4043863.9349,
"spatialReference": {"wkid": 102100, "latestWkid": 3857},
}
},
)
# handle the output
print(f"output item id: {output_result.itemid}")Service requests
Request
POST https://www.arcgis.com/sharing/rest/portals/self HTTP/1.1
Content-Type: application/x-www-form-urlencoded
f=json
&token={ACCESS_TOKEN}
Response (JSON)
{
"helperServices": {
// Other parameters
"rasterAnalytics": {
"url": "https://<YOUR_ANALYSIS_SERVICE>/arcgis/rest/services/tasks/GPServer"
},
"geoenrichment": {
"url": "https://geoenrich.arcgis.com/arcgis/rest/services/World/GeoenrichmentServer"
}
// Other parameters
}
}
What's next?
Learn how to perform raster analysis with raster operations: