1. Prepare data
The preliminary step for most raster analyses is to prepare input raster data. The input data is the data that is analyzed during the operation. In most cases, you will want to perform an analysis with your own data, but you can also use existing data hosted in ArcGIS.
There are a number of ways you can prepare data for analysis, but the easiest way is to use ArcGIS software and tools such as ArcGIS Online, Map Viewer, and ArcGIS Pro. These tools provide an interactive way to find, import, and prepare data.
Regardless of the tools or APIs you use, the raster analysis service requires input data in the form of raster data. The format of the raster data can be in the form of one of the following layer types: Map tile layer, Imagery layer, Tiled imagery layer, and Elevation layer.
The input data for a raster analysis is not changed by the raster analysis service and is treated as read-only. The output data contains changes that were applied during the analysis.
2. Select an operation
The operation you choose to run depends on the type of data you have available and the problem you are wanting to solve. In general, raster analysis operations require existing raster data to use as input parameters. Data can be data you currently have or can be downloaded from various agencies and companies. To learn about data available to you in the ArcGIS system, go to Finding datasources.
Raster operations are categorized into groups based on the type of analysis they perform. To find an appropriate operation for your use case, go to Types of raster operations page.
| Category | Description | Operations | Example |
|---|---|---|---|
| Analyze patterns | Examine and extract information from raster datasets to identify and understand spatial patterns or trends. | Calculate, Compute, Interpolate |

Evaluate the difference between two input rasters with Compute. |
| Analyze terrain | Determine topographic characteristics and features of a land surface using elevation or digital elevation model (DEM) raster datasets. | Create, Surface |

Identify locations on a raster surface that are visible to the input observer locations with Create. |
| Deep learning | Apply deep learning techniques and neural networks to analyze and extract information from raster datasets. | Classify, Classify, Detect |
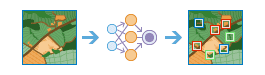
Run a deep learning model on an imagery layer in which each input object is classified with Classify. |
| Manage data | Create, Organize, and convert raster datasets. | Convert, Convert, Sample |

Convert a point, line, or polygon feature layer to a raster with Convert. |
| Multidimensional analysis | Examine and extract information from raster datasets that contain multiple dimensions or variables. Multidimensional raster datasets can store multiple attributes or variables for a location, such as temperature, precipitation, air quality or vegetation indices, collected over time or different spectral bands. | Aggregate, Find, Generate, Generate,Predict |
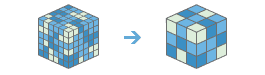
Aggregate existing multidimensional dataset variables along a dimension with Aggregate. |
| Summarize data | Aggregate or condense raster data to provide a concise representation of its properties using summary statistics, such as mean, minimum, maximum, standard deviation, or count within specific spatial units or zones. | Summarize, Zonal |
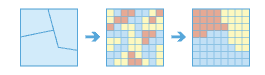
Summarize the cells of a raster within the boundaries of zones defined by another dataset with Summarize. |
| Proximity analysis | Use distance to determine accumulation, allocation, or find paths between the cells of a raster dataset. | Distance, Distance, Optimal, Optimal, Optimal |

Calculate accumulated distance for each cell to sources with Distance. |
3. Perform the analysis
You can use different developer tools and APIs to perform an analysis. Regardless of the mechanism you use, they all require user authentication to make requests to the raster analysis service and the transactions need to managed as job requests (long transactions).
The easiest way to programmatically perform an analysis operation is to use client APIs. These APIs provide authentication classes and also simplify the process of executing and managing job requests.
The general steps to perform an analysis include:
- Import the appropriate modules.
- Implement authentication to obtain an access token.
- Identify the input parameters for the analysis.
- Make the request.
- Handle the results
const jobParams = {
inputZoneLayer: {
url:
"https://services.arcgis.com/P3ePLMYs2RVChkJx/arcgis/rest/services/USA_Census_Counties/FeatureServer/0",
filter: "STATE_NAME = 'Alabama'",
},
inputRasterLayerToSummarize: {
url:
"https://tiledimageservices3.arcgis.com/GVgbJbqm8hXASVYi/arcgis/rest/services/US_Annual_Temperature/ImageServer",
},
zoneField: "COUNTY_FIPS",
shapeUnits: "Miles",
// Output a hosted tiled imagery layer
outputName: {
serviceProperties: {
name: "JSAPI - Alabama average temperature",
capabilities: "Image, TilesOnly",
},
itemProperties: {
description:
"output generated from the summarizeRasterWithin operation",
title: "Alabama average temperature[JSAPI]",
},
},
}
const job = await EsriGeoprocessor.submitJob(analysisURL, jobParams)
const res = await job.waitForJobCompletion({interval:5000, statusCallback: (j)=>{
console.log(`Job status: ${j.jobStatus}`)
}})
if (res.jobStatus === "job-succeeded"){
const r = await res.fetchResultData("aggregatedLayer")
const resultLayer = new FeatureLayer({portalItem: {id: r.value.itemId}})
map.add(resultLayer)
}
4. Display the results
The final step is to display the results on a map. Depending on the client-side mapping library you are using, you can use a view to display the data in 2D as a map or 3D as a scene. You also need to set the location and zoom level or scale of the view.
The steps to display the map are:
- Reference the mapping library.
- Create a map.
- Set the service URL or item ID for the result layer.
- Add the layer to the map.
- Set the map location.
- Set the zoom level or scale.
- Display the result.
const resultLayer = new EsriImageryTileLayer({
portalItem: { id: "c5331694510447f08ffbcf37451301d1" },
})
const view = new EsriMapView({
center: [-87.0045, 32.6719],
zoom: 6,
container: "viewDiv",
map: new EsriMap({
basemap: "arcgis/light-gray",
layers: [resultLayer],
}),
})