Learn how to perform a raster analysis with raster operations.

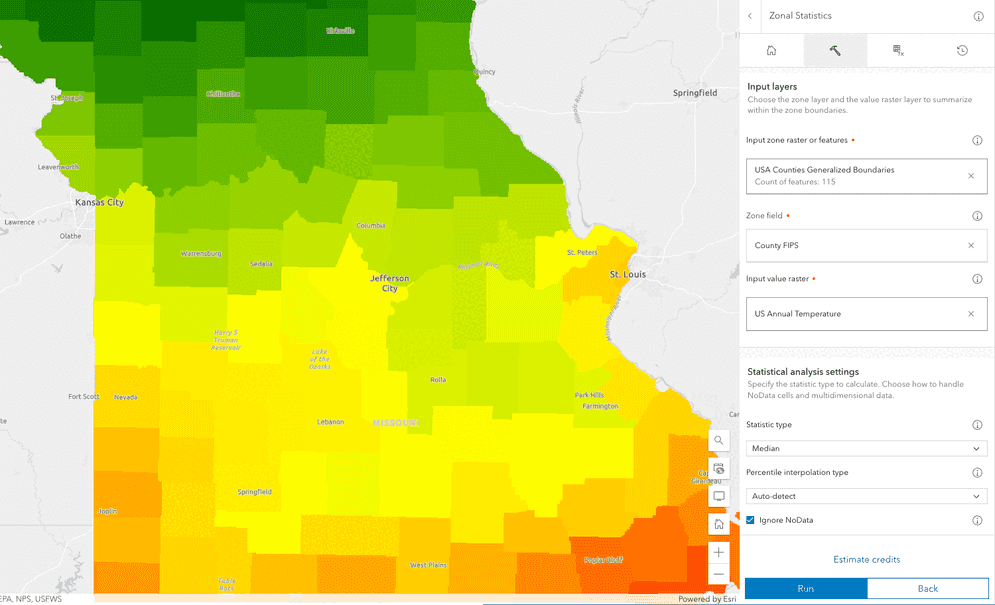
A zonal statistics operation calculates statistics on cell values of a raster within the zones defined by another dataset. The types of statistics you can calculate include Mean, Majority, Maximum, Median, Minimum, Minority, Sum, Percentile, Range, and Standard deviation.
Common use cases for performing a zonal statistics operation are:
- Summarizing land cover types within administrative boundaries.
- Analyzing elevation statistics within zones.
- Summarizing soil properties within agricultural fields.
- Analyzing vegetation indices within ecological Zones.
In this tutorial, you use the Summarize and Convert operations to find the average annual temperature for each of the 67 counties in Alabama and then convert the output imagery layer to a feature service. You can perform the summarize analyses either in Map Viewer or programmatically using the ArcGIS API for Python, ArcGIS REST JS, and ArcGIS REST APIs.
The analyses include:
- Calculating the mean temperature value for each feature in a feature service.
- Creation of a new hosted imagery layer containing the results of the analysis.
Prerequisites
Steps
Copy the web map
The tutorial web map contains predefined layers to use as the starting point for the analyses outlined in the steps below.
- Go to the Zonal statistics tutorial data web map and click Sign in.
- Verify that you have the following layers by toggling the visibility on and off:
- Graffiti cases within San Francisco
- Census blocks in three neighborhoods SF
- Click Save > Save As > Save Map to save a copy.
Calculate zonal statistics
The County boundaries hosted feature layer from the ArcGIS Living Atlas contains all the county polygons in the United States. A filter expression has been applied to limit the counties processed to Alabama. The US Annual Temperature hosted imagery layer contains average temperature values across the United States. Use the Summarize operation to calculate the average temperature of each county.
-
In the right side bar, click the Analysis tool to open the analysis pane.
-
Click Tools to open the list of available tools and type in Zonal Statistics in the search bar.
-
Click on Zonal Statistics to open the tool window.
-
Set the following input layer parameters:
- Input zone raster of features:
County boundariesThe count of features should be 67 - Zone field:
County FIPS - Input value raster:
US annual temperature
- Input zone raster of features:
-
Set the following statistical analysis settings parameters:
- Stastic type:
Mean - Add a check to the Ignore NoData parameter.
- Stastic type:
-
Set the Result layer parameters to:
- Output raster name:
Zonal statistics tutorial result - Output layer type:
Tiled imagery layer
- Output raster name:
-
Click on Estimate credits. The analysis will consume USD $0.11 (1.13) credits.
-
Click the Run button to start the analysis. After a short period of time an alert should display indicating the analysis has been submitted.
-
Click the History button in the top right of the Analysis pane to view the progress of the analysis.
-
Once the analysis has completed, the result layer will be added to the map.
A new tiled imagery layer will be created in your portal with the analysis result.
APIs
The general steps for performing the analysis programmatically are:
- Implement user authentication to access the raster analysis service.
- Define the parameters of the request.
- Make the request. Note: This is a long transaction managed with a job request.
- Handle the results.
# USA County layer from living atlas
zone_layer_item = portal.content.get("14c5450526a8430298b2fa74da12c2f4")
zone_layer = zone_layer_item.layers[0]
# filter this layer on a specific state name
zone_layer.filter = "STATE_NAME='Alabama'"
# annual temperature raster layer item
raster_layer_item = portal.content.get("a8b93a96c7224a69a5b387722b89a6ee")
raster_layer = raster_layer_item.layers[0]
# perform the operation
summarized_layer = summarize_raster_within(
input_zone_layer=zone_layer,
input_raster_layer_to_summarize=raster_layer,
zone_field="COUNTY_FIPS",
statistic_type="Mean",
)
print(f"Summarize raster within hosted imagery layer created {summarized_layer.itemid}")
Service requests
Request
POST https://www.arcgis.com/sharing/rest/portals/self HTTP/1.1
Content-Type: application/x-www-form-urlencoded
token={ACCESS_TOKEN}
f=json
Response (JSON)
{
"helperServices": {
// Other parameters
"rasterAnalytics": {
"url": "https://<YOUR_ANALYSIS_SERVICE>/arcgis/rest/services/tasks/GPServer"
},
"geoenrichment": {
"url": "https://geoenrich.arcgis.com/arcgis/rest/services/World/GeoenrichmentServer"
}
// Other parameters
}
}
Convert the result layer
-
In the right side bar, click the Analysis tool to open the analysis pane.
-
Click Tools to open the list of available tools and type in Convert Raster to Feature in the search bar.
-
Click on Convert Raster to Feature in the result list to open the tool window.
-
Set the following Input layer parameters:
- Input raster layer to convert:
Zonal statistics tutorial resultThis will be the imagery layer you generated in the step above
- Input raster layer to convert:
-
Set the following Conversion settings parameters:
- Field to convert:
Value - Output type:
Polygon - Simplify lines of polygons:
true - Create multipart features:
true
- Field to convert:
-
Set the Result layer parameters to:
- Output raster name:
Converted zonal statistics result
- Output raster name:
-
Click on Estimate credits. The analysis will consume USD $0.10 (1 credit).
-
Click the Run button to start the analysis. After a short period of time an alert should display indicating the analysis has been submitted.
-
Click the History button in the top right of the Analysis pane to view the progress of the analysis.
-
Once the analysis has completed, the result layer will be added to the map.
A new hosted feature layer will be created in your portal with the analysis result.
APIs
The general steps for performing the analysis programmatically are:
- Implement user authentication to access the raster analysis service.
- Define the parameters of the request.
- Make the request. Note: This is a long transaction managed with a job request.
- Handle the results.
# Input raster layer
input_raster_item = portal.content.get("c04d376b57484a6685163f56f209063c")
input_raster_layer = input_raster_item.layers[0]
# perform the operation
converted_layer = convert_raster_to_feature(
input_raster=input_raster_layer,
field="Value",
output_type="Polygon",
simplify=True,
create_multipart_features=True,
output_name="Converted zonal statistics python")
print(f"Converted raster layer to feature layer created {converted_layer.itemid}")
Service requests
Request
POST https://www.arcgis.com/sharing/rest/portals/self HTTP/1.1
Content-Type: application/x-www-form-urlencoded
f=json
&token={ACCESS_TOKEN}
Response (JSON)
{
"helperServices": {
// Other parameters
"rasterAnalytics": {
"url": "https://<YOUR_ANALYSIS_SERVICE>/arcgis/rest/services/tasks/GPServer"
},
"geoenrichment": {
"url": "https://geoenrich.arcgis.com/arcgis/rest/services/World/GeoenrichmentServer"
}
// Other parameters
}
}
What's next?
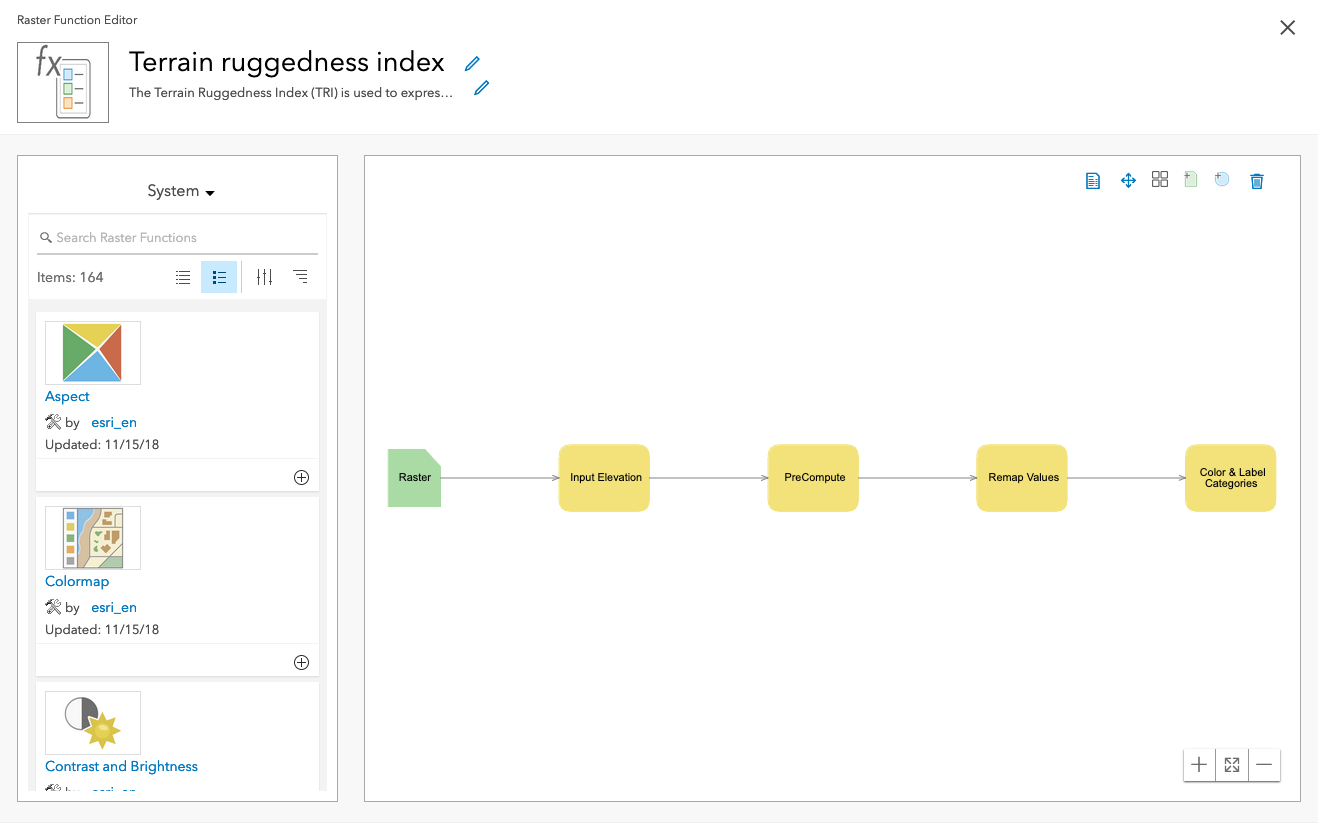
Learn how to perform raster analysis with raster functions:
