ArcGIS provides a comprehensive suite of raster analysis capabilities you can use in your applications. The operations can be accessed using interactive tools and client APIs.
The operations are categorized into groups based on the functionality they provide:
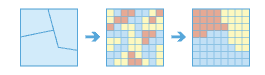
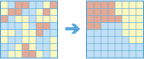
- Summarize data: Summarize raster values within zones or areas.
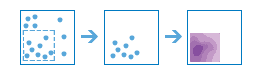
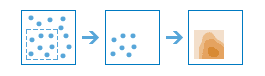
- Analyze patterns: Identify, quantify, and visualize spatial patterns in raster data.
- Proximity analysis: Analyze distance relationships and spatial patterns within raster data.
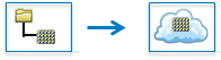
- Terrain analysis: Enable a wide range of applications like site selection, hydrologic modeling, visibility analysis, solar radiation mapping, and more by deriving key terrain parameters and characteristics from elevation data.
- Manage data: Prepare raster inputs for further analysis and enable workflows like creating seamless raster mosaics, clipping rasters to areas of interest, reclassifying values, and converting between raster and vector data formats.
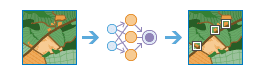
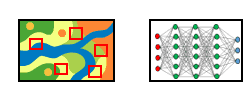
- Deep learning: Tasks for object detection, pixel/image classification, training data preparation, and model training - enabling end-to-end deep learning workflows for raster analysis.
- Generalize: Simplify input raster datasets by reducing the number of unique cell values, effectively reducing data volume and complexity
- Multidimensional analysis: Process, analyze, manage, and extract information from complex multidimensional raster datasets composed of multiple variables and dimensions.
- Classify data: Prepare segmented or pixel-based rasters for classification.
- Overlay: Combine two or more raster datasets into a single output raster through weighted, arithmetic, max/min, and sum overlay methods.
Summarize data
| Map Viewer tool name | REST API Operation | Description | Result | Example |
|---|---|---|---|---|
| Zonal Statistics | Summarize Raster Within | Summarize the cells of a raster within the boundaries of zones defined by another dataset. | A new hosted imagery layer. |
|
| Zonal Statistics As Table | Zonal Statistics As Table | Summarize the cells of a raster within the boundaries of zones defined by another dataset. | A new hosted table. |

|
| Not available | Summarize Categorical Raster | Generates a table containing the pixel count for each class, in each slice of an input categorical raster. | A new hosted table. |
|
| Not available | Sample | Create a table of cell values from a raster, or set of rasters, for defined locations. | A new hosted table. |

|
Analyze patterns
| Map Viewer tool name | REST API Operation | Description | Result | Example |
|---|---|---|---|---|
| Calculate Density | Calculate Density | Creates a density layer from point features by spreading known quantities of some phenomenon (represented as attributes of the points) across the raster. | hosted imagery layer hosted tiled imagery layer |
|
| Interpolate Points | Interpolate Points | Predict values at new locations based on measurements from a collection of points. |
| |
| Not available | Compute Change Raster | Evaluate the difference between two input rasters. |

|
Proximity analysis
| Map Viewer tool name | REST API Operation | Description | Result | Example |
|---|---|---|---|---|
| Distance Accumulation | Distance Accumulation | Calculates the accumulated distance for each cell to sources, allowing for straight-line distance, cost distance, true surface distance, as well as vertical and horizontal cost factors. | hosted tiled imagery layer |

|
| Distance Allocation | Distance Allocation | Calculates the distance allocation for each cell to the provided sources based on straight-line distance, cost distance, true surface distance, as well as vertical and horizontal cost factors. | hosted imagery layer hosted tiled imagery layer |
|
| Optimal Path As Line | Optimal Path As Line | Calculates the optimal path from a source to a destination as a feature. | hosted feature layer |

|
| Optimal Path As Raster | Optimal Path As Raster | Calculates the optimal path from a source to a destination as a raster. | hosted imagery layer hosted tiled imagery layer |
|
| Optimal Region Connections | Optimal Region Connections | Calculates the optimal connectivity network between two or more input regions. | hosted feature layer(s) |

|
Terrain analysis
| Map Viewer tool name | Operation | Description | Result | Example |
|---|---|---|---|---|
| Geodesic Viewshed | CreateViewshed | Use an elevation surface and observer locations to identify areas where the observers can see the observed objects and the observed objects can see the observers. | hosted imagery layer |

|
| Surface Parameters | SurfaceParameters | Determine the parameters of a surface raster such as types of curvatures, slope, and aspect. | hosted imagery layer |
|
| Derive Continuous Flow | DeriveContinuousFlow | Generates a raster of accumulated flow into each cell from an input surface raster with no prior sink or depression filling required. | Image service | |
| Fill | Fill | Fills the sinks in a surface raster to remove small imperfections in the data. | Image service |

|
| Flow Accumulation | Flow accumulation | Create a raster of accumulated flow into each cell. A weight factor can optionally be applied. | Image service |

|
| Flow Direction | FlowDirection | Create a raster of flow direction from each cell to its steepest downslope neighbor. | Image service |

|
| Flow Distance | FlowDistance | Computes the downslope horizontal or vertical distance to cells in a stream or river into which they flow. | Image service |

|
| Stream Link | StreamLink | Assigns unique values to sections of a raster linear network between intersections. | Image service |

|
| Watershed | Watershed | Determines the contributing area above a set of cells in a raster. | Image service |

|
Manage Data
| Map Viewer tool name | REST API Operation | Description | Result | Example |
|---|---|---|---|---|
| Not available | Add Image | Add new images to an existing image collection. | hosted imagery layer |

|
| Convert Feature to Raster | Convert Feature to Raster | Converts point, line, or polygon feature dataset to a raster. | hosted imagery layer |

|
| Not available | Convert Raster Function Template | Converts a raster function template between JSON and XML formats. | item | |
| Convert Raster to Feature | Convert Raster to Feature | Converts a raster to a point, line, or polygon feature dataset. | hosted feature layer |

|
| Not available | Copy Raster | Takes a single raster layer input and generates the output image using parallel processing. The input raster dataset can be clipped, resampled, and reprojected based on the setting. | hosted imagery layer |
|
| Not available | Create Image Collection | Takes multiple image items as input, creates an image collection in a registered data store, and publishes it as an image service. The input raster dataset can be clipped, resampled, and reprojected based on the setting. The image upload can also be run in parallel. | hosted imagery layer |

|
| Not available | Delete Image | Remove existing images from an image collection. The service will only delete the raster item in the mosaic dataset and will not remove the source image. |

| |
| Not available | Delete Image Collection | Deletes the image collection image service, that is, the portal-hosted image layer item. It will not delete the source images that the image collection references. |

| |
| Not available | Download Raster | Download an image or partial image at a designated resolution. The input image service must be configured to allow pixel data download. |

| |
| Not available | Generate Raster | Execute raster analysis on a distributed server deployment. The analysis can be specified either with a predefined server raster function keyword or by giving a JSON object representation of a raster function chain. |
|
Deep Learning
| Map Viewer tool name | REST API Operation | Description | Result | Example |
|---|---|---|---|---|
| Classify Objects Using Deep Learning | ClassifyObjectsUsingDeepLearning | Classify objects based on overlaid imagery data using the designated deep learning model and generate a feature service with a new assigned label for each object. | Hosted feature layer |
|
| Classify Pixels Using Deep Learning | Classify Pixels Using Deep Learning | Classify pixels using the designated deep learning model and generate an image service for the classified raster. | Hosted imagery layer |
|
| Detect Change Using Deep Learning | DetectChangeUsingDeepLearning | Detect change between two rasters. | Hosted imagery layer | |
| Detect Objects Using Deep Learning | DetectObjectsUsingDeepLearning | Detect objects from imagery data using the designated deep learning model and generate a feature service for the detected objects. | Hosted imagery layer |
|
| Not available | ExportTrainingDataForDeepLearning | Generate training sample image chips from the input imagery data with labeled vector data or classified images. | Data store path string where the output image chips, labels, and metadata files will be stored. |
|
| Not available | InstallDeepLearningModel | Install the uploaded deep learning model package (.dlpk) from portal to the raster analysis image server. The upload model package will be unpacked and saved to the server configuration store. | Path string to uploaded package (.emd) |
|
| Not available | ListDeepLearningModels | List all the installed deep learning models on the raster analysis image server. | JSON Array of installed models |
|
| Not available | PublishDeepLearningModel | Publishes a model package of a deep learning model (.dlpk) containing the files and data required to run deep learning inferencing tools for object detection or image classification to your portal as a DLPK item. | Item ID of published model |
|
| Not available | QueryDeepLearningModelInfo | Extract the deep learning model specific settings from the model package item or model definition file. | JSON structure describing the deep learning model. |

|
| Not available | TrainDeepLearningModel | Train a deep learning model using the output from the Export operation. This task can also be used to write the deep learning model package to a file share data store location. | Portal item (.dlpk) |

|
| Not available | UninstallDeepLearningModel | Uninstall the uploaded deep learning model package (.dlpk) from the raster analysis image server. It will delete the named deep learning model from the image server's configuration store but not the portal item. | Item ID of uninstalled model |

|
Genaralize
| Map Viewer tool name | REST API Operation | Description | Result | Example |
|---|---|---|---|---|
| Nibble | Nibble | Replaces the input cells corresponding to a mask with the values of the nearest neighbors. | Hosted imagery layer |

|
Multidimensional analysis
| Map Viewer tool name | REST API Operation | Description |
|---|---|---|
| Aggregate Multidimensional Raster | The AggregateMultidimensionalRaster task can be used to generate a .CRF multidimensional raster dataset and image service by aggregating existing multidimensional dataset variables along a dimension. | |
| Analyze Changes Using CCDC | The AnalyzeChangesUsingCCDC task evaluates changes in pixel values over time using the CCDC algorithm, and generates a multidimensional raster containing the model results. | |
| Analyze Changes Using LandTrendr | The AnalyzeChangesUsingLandTrendr task evaluates changes in pixel values over time using the Landsat based detection of trends in disturbance and recovery (LandTrendr) method and generates a change analysis raster containing the model results. | |
| Build Multidimensional Transpose | The BuildMultidimensionalTranspose task transposes a multidimensional raster dataset, which divides the multidimensional data along each dimension to optimize performance when accessing pixel values across all slices. | |
| Detect Change Using Change Analysis Raster | The DetectChangeUsingChangeAnalysisRaster task generates a raster containing pixel change information using the output change analysis raster from the AnalyzeChangesUsingCCDC task or the AnalyzeChangesUsingLandTrendr task. | |
| Find Argument Statistics | The FindArgumentStatistics task is used to extract the dimension value or band index at which a given statistic is attained for each pixel in a multidimensional or multiband raster. | |
| Generate Multidimensional Anomaly | The GenerateMultidimensionalAnomaly task is used to compute the anomaly for each slice in a multidimensional raster to generate a multidimensional raster. An anomaly is the deviation of an observation from its standard or mean value. | |
| Generate Trend Raster | The GenerateTrendRaster task allows you estimate the trend for each pixel along a dimension for one or more variables in a multidimensional raster. | |
| Manage Multidimensional Raster | The ManageMultidimensionalRaster task edits a multidimensional raster by adding or deleting variables or dimensions. | |
| Merge Multidimensional Rasters | The MergeMultidimensionalRasters task combines multiple multidimensional raster datasets spatially or across variables and dimensions. | |
| Predict Using Regression Model | Predicts data values using the output from the TrainRandomTreesRegressionModel tool. | |
| Predict Using Trend Raster | The PredictUsingTrendRaster task is used to compute a forecasted multidimensional raster using the output trend raster from the Generate Trend Raster tool. | |
| Subset Multidimensional Raster | The SubsetMultidimensionalRaster task creates a subset of a multidimensional raster by slicing data along defined variables and dimensions. |
Classify Data
| Operation | Description |
|---|---|
| Classify | The Classify task creates categories of pixels based on the input raster and the classifier definition JSON that was generated from the TrainClassifier service. |
| Linear Spectral Unmixing | The LinearSpectralUnmixing task performs subpixel classification and calculates the fractional abundance of end members for individual pixels. |
| Segment | The Segment task groups adjacent pixels that have similar spectral and spatial characteristics into segments. |
| Train Classifier | The TrainClassifier task is a service to train image classifiers in a deep learning model and return an .ecs file in JSON format. The .ecs file is used in the Classify task. |
| Train Random Trees Regression Model | Models the relationship between explanatory variables (independent variables) and a target dataset (dependent variable). |
Overlay
| Operation | Description |
|---|---|
| LocateRegions | The LocateRegions task identifies the best regions, or groups of contiguous cells, from an input utility (suitability) raster that satisfy a specified evaluation criterion and that meet identified shape, size, number, and interregion distance constraints. |