Manually attach the Visual Studio debugger to a service process
Alternatively, you can also manually attach the Visual Studio debugger to the service process. To properly attach the debugger to the designated ArcGIS Server Object Container (ArcSOC) service process, do the following:
-
Run Visual Studio as Administrator and open the SOE or SOI project.
-
Build the project in Debug mode. Keep the project open when performing the remainder of these steps.
-
Deploy the updated .soe file in Manager and enable the extension with the service. Take a note of the map service name.
-
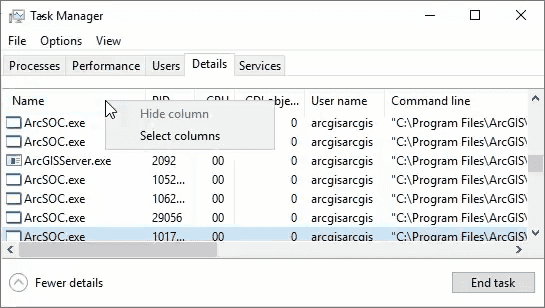
Open Windows Task Manager and click the Details tab. Right-click any column name and choose Select columns.

-
Confirm that PID and Command line are both checked. Click OK.
-
Now examine all the ArcSOC.exe processes and find the one with a matching map service name in "-DService=xxxx.MapServer..." of the Command line column. Take a note of the PID of this ArcSOC.exe.

For shared instances, you should look for the ArcSOC.exe process with a matching service name as "-DService=DynamicMappingHost.MapServer" in the Command line column. You can set Number of shared instances per machine to
1at Server Manager >** Site** > Settings > Pooling, to allow only one DynamicMappingHost ArcSOC process running. This can make it easier to find the DynamicMappingHost process to attach to. -
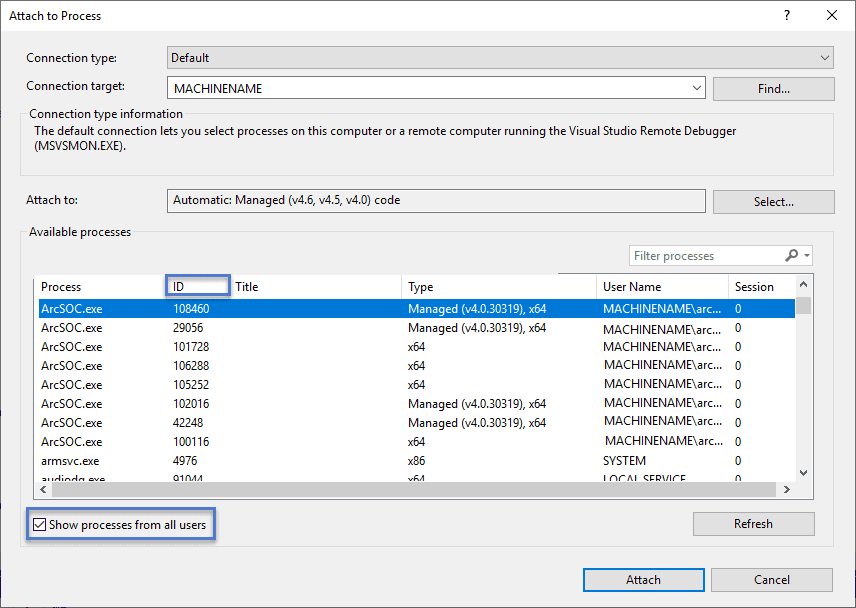
Return to Visual Studio and click Debug > Attach to Process to open the Attach to Process dialog box.
Confirm Show processes from all users is checked.
Choose the ArcSOC.exe with the PID from the last step and click Attach.
Click Attach again when the Attach Security Warning dialog box appears.

-
Now the debugger is attached to the service process. You can perform certain service operations to trigger the breakpoints and step through the code as you normally would. For example, if you put a breakpoint at the
Handlefunction, once you execute a REST operation from a browser (such asREST Request() http), the breakpoint will be hit.:// <mapservice-url >/export
Enable debugging of the extension's initialization phase
If you want to debug the initialization phase of an extension, which is theInit()function for both SOE and SOI, perform the following steps to ensure enough time is available to manually attach a debugger to the service process.
Note: You don't need to do these steps if you choose to automatically attach the Visual Studio debugger.
Debug extension's Init() method for dedicated instances
-
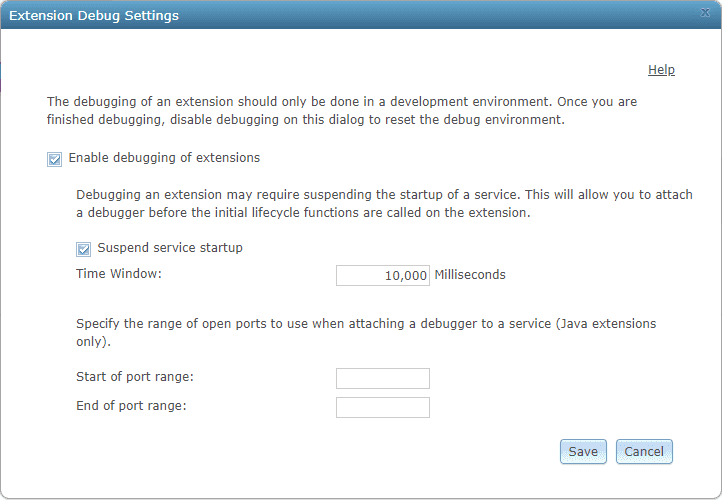
Browse to ArcGIS Server Manager > Site > Extensions. Click the Debug Settings button.
-
Check Enable debugging of extensions to enable debugging.
-
Check the Suspend service startup option and provide a time window in milliseconds, if you want to debug into the life cycle methods of your extension. Examples of life cycle methods are
Init()andShutdown().
These methods are invoked by the parent map service during the startup and shutdown phases. When the service starts, ArcGIS Server freezes initialization of the service extension for the duration specified by this time window, allowing you enough time to attach the debugger before a breaking point in
Init()is hit. -
Ignore the options for specifying a port range. This only applies to debugging extensions built with Java.
-
Click Save. Debugging is now enabled on ArcGIS Server.
-
Set a breakpoint in the
Init()method of the extension. -
Repeat steps 1 through 8 in the manually attach the Visual Studio debugger section, and make sure the Visual Studio debugger is attached to the service process within the time window set in Extension Debug Settings. Shortly, the breakpoint set in the last step will be hit.
-
Make sure you uncheck the Enable debugging of extensions option after you finish debugging the extension.
Debug extension's Init() method for shared instances
-
Add a breakpoint at the extension's
Init()method. -
Follow the instructions to manually attach the Visual Studio debugger.
-
Start the service with the extension enabled.
-
Send a request to the extension to trigger its
Init()method.Since starting the service that uses the shared instance pool will not trigger its extension's
Init()method, you must send a request that will come through the extension to trigger theInit()method. For example, the REST SOE'sInit()method will not be called until you visit the REST endpoint of the SOE or send a REST request to the SOE, and the SOI'sInit()method will not be called until you send a request to the service with which the SOI is enabled. -
You should see the breakpoint is hit. You can continue debugging through your extension's initialization phase.
-
If you want to debug the
Shutdown()method, you can manually stop the service, which will trigger theShutdown()method.