This covers the Spark SQL workflow that replicates the Dissolve Boundaries tool. Dissolve Boundaries merges geometries that intersect or have the same field value into a single geometry. This workflow will dissolve the USA States data by region, calculate the summary statistics for each dissolved region, and convert the dissolved multipart geometries into singlepart geometries.
Prerequisites
To complete the following steps, you will need:
- A running Spark session configured with ArcGIS GeoAnalytics Engine.
- A notebook connected to your Spark session (e.g. Jupyter, JupyterLab, Databricks, EMR, etc.).
- An internet connection (for accessing sample data).
Steps
Import
-
In your notebook, import
geoanalyticsand authorize the module using a username and password, or a license file.Python Python Scala Use dark colors for code blocks Copy import geoanalytics from geoanalytics.sql import functions as ST from pyspark.sql import functions as F geoanalytics.auth(username="user1", password="p@ssword")
Read the sample data and plot
-
Create a DataFrame from a feature service of the state boundaries in the United States and display columns of interest.
Python Python Scala Use dark colors for code blocks Copy # Create a DataFrame from the USA States Boundaries feature service url = "https://services.arcgis.com/P3ePLMYs2RVChkJx/ArcGIS/rest/services/USA_State_Boundaries/FeatureServer/0" df = spark.read.format("feature-service").load(url) # Display the first 5 rows of the DataFrame df.select('STATE_NAME', "SUB_REGION", "POP2010").show(5)ResultUse dark colors for code blocks Copy +----------+----------+--------+ |STATE_NAME|SUB_REGION| POP2010| +----------+----------+--------+ | Alaska| Pacific| 710231| |California| Pacific|37253956| | Hawaii| Pacific| 1360301| | Idaho| Mountain| 1567582| | Nevada| Mountain| 2700551| +----------+----------+--------+ only showing top 5 rows -
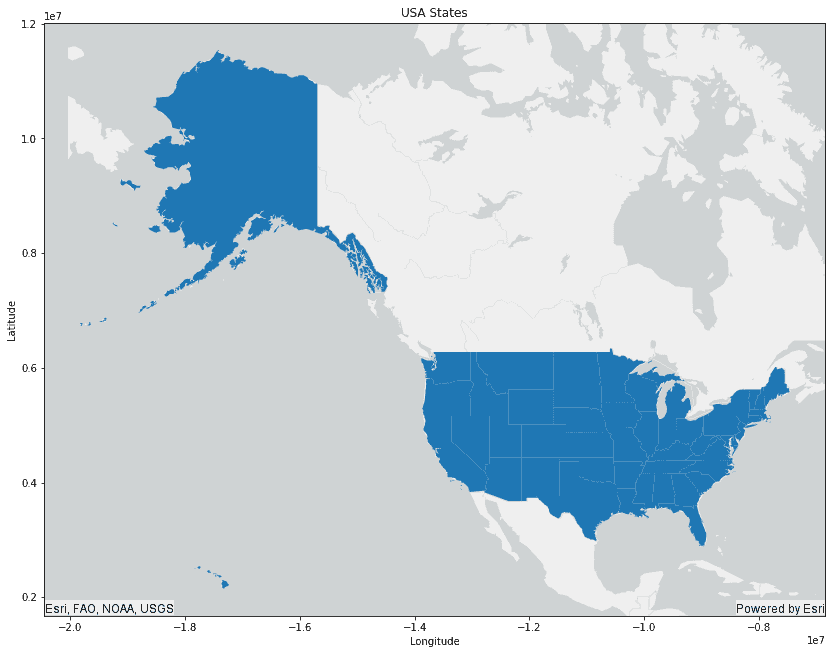
Plot the USA States data.
PythonUse dark colors for code blocks Copy # Plot the USA States data df_plot = df.st.plot(figsize=(14, 14), basemap='light') df_plot.set_title("USA States") df_plot.set_xlabel("Longitude") df_plot.set_ylabel("Latitude")
Dissolve States by region
-
Use the
STPython function to dissolve the States by the_Aggr _Union SUBfield to create multipart geometries._REGION Python Python Scala Use dark colors for code blocks Copy # Dissolve by SUB_REGION and create multipart geometries df_dissolved_multipart = df.groupBy("SUB_REGION").agg(ST.aggr_union("shape").alias("dissolved_geom_multipart")) \ .withColumn("wkt", ST.as_text("dissolved_geom_multipart")) df_dissolved_multipart.show(10)ResultUse dark colors for code blocks Copy +------------------+------------------------+--------------------+ | SUB_REGION|dissolved_geom_multipart| wkt| +------------------+------------------------+--------------------+ | Pacific| {"rings":[[[-1.78...|MULTIPOLYGON (((-...| | Mountain| {"rings":[[[-1.32...|POLYGON ((-1.3263...| |West South Central| {"rings":[[[-1.17...|MULTIPOLYGON (((-...| |West North Central| {"rings":[[[-1.05...|POLYGON ((-1.0583...| |East South Central| {"rings":[[[-9469...|POLYGON ((-946995...| | New England| {"rings":[[[-8185...|MULTIPOLYGON (((-...| | South Atlantic| {"rings":[[[-8993...|MULTIPOLYGON (((-...| |East North Central| {"rings":[[[-9804...|MULTIPOLYGON (((-...| | Middle Atlantic| {"rings":[[[-8403...|MULTIPOLYGON (((-...| +------------------+------------------------+--------------------+ -
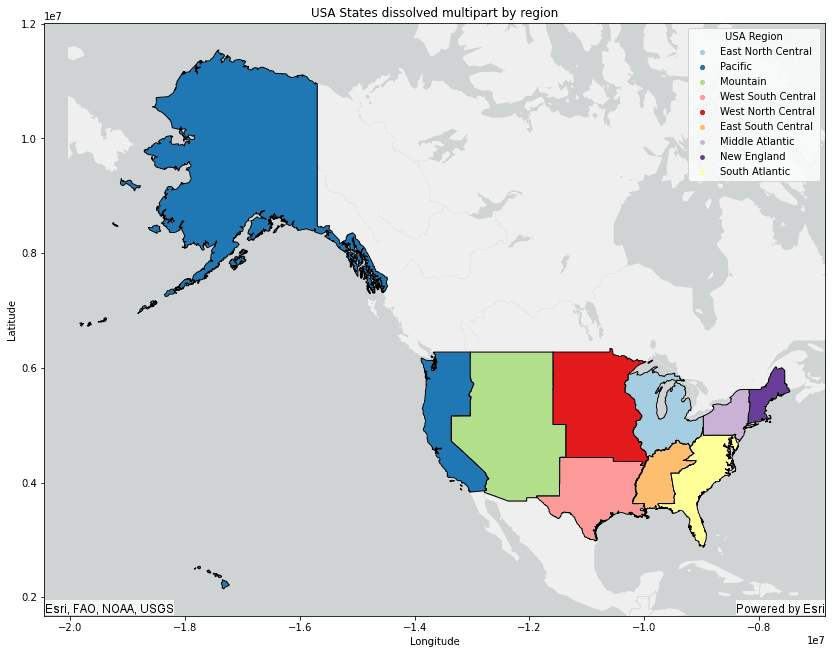
Plot the dissolved multipart geometries.
PythonUse dark colors for code blocks Copy # Plot the dissolved multipart geometries df_dissolved_multipart_plot = df_dissolved_multipart.st.plot(cmap_values="SUB_REGION", is_categorical=True, cmap="Paired", legend=True, legend_kwds={'title':"USA Region"}, figsize=(14, 14), edgecolor="black", basemap="light") df_dissolved_multipart_plot.set_title("USA States dissolved multipart by region") df_dissolved_multipart_plot.set_xlabel("Longitude") df_dissolved_multipart_plot.set_ylabel("Latitude")
Calculate summary statistics for the dissolved regions
A full list of summary statistics can be found in summary statistics.
-
Calculate the total population for each region.
Python Python Scala Use dark colors for code blocks Copy # Get the sum of the population for each "SUB_REGION" df.groupBy("SUB_REGION").sum().select("SUB_REGION", "sum(POP2010)").show(10)ResultUse dark colors for code blocks Copy +------------------+------------+ | SUB_REGION|sum(POP2010)| +------------------+------------+ | Pacific| 49880102| |West South Central| 36346202| | Middle Atlantic| 40872375| | South Atlantic| 59777037| |East North Central| 46421564| | New England| 14444865| | Mountain| 22065451| |East South Central| 18432505| |West North Central| 20505437| +------------------+------------+ -
Calculate the number of States within each region.
Python Python Scala Use dark colors for code blocks Copy # Get the count of States within each "SUB_REGION" df.groupBy("SUB_REGION").count().select("SUB_REGION", "count").show(10)ResultUse dark colors for code blocks Copy +------------------+-----+ | SUB_REGION|count| +------------------+-----+ |West South Central| 4| |West North Central| 7| | South Atlantic| 9| | Pacific| 5| | New England| 6| | Mountain| 8| | Middle Atlantic| 3| |East South Central| 4| |East North Central| 5| +------------------+-----+
Create dissolved singlepart geometries
-
Convert the dissolved multipart geometries into dissolved singlepart geometries using the
STfunction and the Spark_Geometries Explodefunction.Python Python Scala Use dark colors for code blocks Copy # Create dissolved singlepart geometries from the dissolved multipart geometries df_dissolved_singlepart = df_dissolved_multipart.select("SUB_REGION", F.explode(ST.geometries("dissolved_geom_multipart")) \ .alias("dissolved_geom_singlepart")) \ .withColumn("wkt", ST.as_text("dissolved_geom_singlepart")) \ .withColumn("index", F.monotonically_increasing_id()) df_dissolved_singlepart.orderBy("SUB_REGION", desc=False).show(20)ResultUse dark colors for code blocks Copy +------------------+----------------------------+--------------------+-----+ | SUB_REGION|dissolved_geom_non_multipart| wkt|index| +------------------+----------------------------+--------------------+-----+ |East North Central| {"rings":[[[-9851...|POLYGON ((-985149...| 79| |East North Central| {"rings":[[[-9804...|POLYGON ((-980408...| 77| |East North Central| {"rings":[[[-9851...|POLYGON ((-985185...| 80| |East North Central| {"rings":[[[-9688...|POLYGON ((-968863...| 78| |East North Central| {"rings":[[[-9334...|POLYGON ((-933466...| 81| |East South Central| {"rings":[[[-9469...|POLYGON ((-946995...| 57| | Middle Atlantic| {"rings":[[[-8403...|POLYGON ((-840342...| 82| | Middle Atlantic| {"rings":[[[-8264...|POLYGON ((-826401...| 85| | Middle Atlantic| {"rings":[[[-8158...|POLYGON ((-815894...| 84| | Middle Atlantic| {"rings":[[[-8210...|POLYGON ((-821005...| 83| | Mountain| {"rings":[[[-1.32...|POLYGON ((-1.3263...| 46| | New England| {"rings":[[[-7933...|POLYGON ((-793364...| 59| | New England| {"rings":[[[-7859...|POLYGON ((-785963...| 60| | New England| {"rings":[[[-8185...|POLYGON ((-818536...| 58| | New England| {"rings":[[[-7795...|POLYGON ((-779589...| 61| | New England| {"rings":[[[-7612...|POLYGON ((-761290...| 62| | Pacific| {"rings":[[[-1.78...|POLYGON ((-1.7819...| 0| | Pacific| {"rings":[[[-1.77...|POLYGON ((-1.7737...| 1| | Pacific| {"rings":[[[-1.75...|POLYGON ((-1.7552...| 2| | Pacific| {"rings":[[[-1.74...|POLYGON ((-1.7445...| 3| +------------------+----------------------------+--------------------+-----+ only showing top 20 rows -
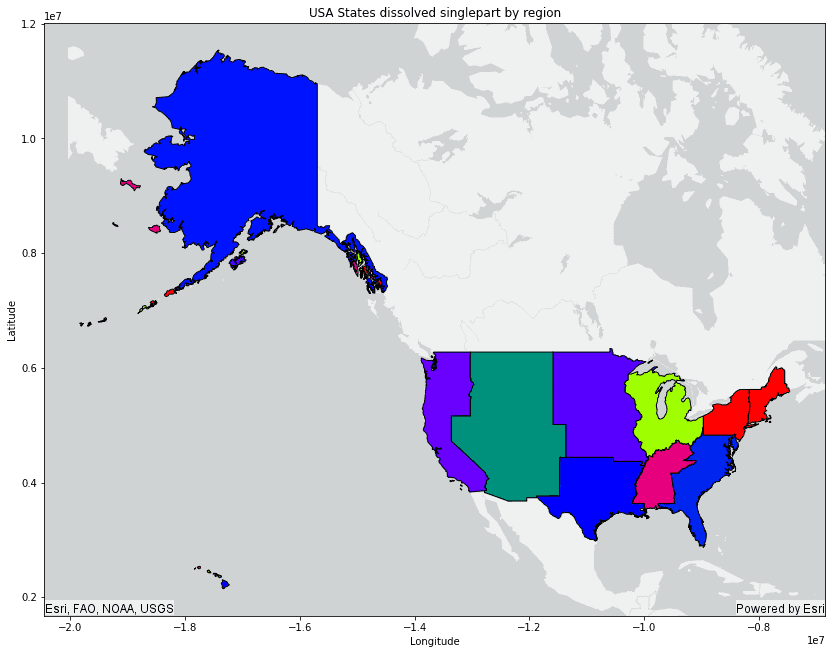
Plot the dissolved singlepart geometries.
PythonUse dark colors for code blocks Copy # Plot the dissolved singlepart geometries df_dissolved_singlepart_plot = df_dissolved_singlepart.st.plot(cmap_values="index", is_categorical=True, cmap="prism", figsize=(14, 14), edgecolor="black", basemap="light") df_dissolved_singlepart_plot.set_title("USA States dissolved singlepart by region") df_dissolved_singlepart_plot.set_xlabel("Longitude") df_dissolved_singlepart_plot.set_ylabel("Latitude")
What's next?
See below for some related topics:
- ST_Aggr_Intersection—Calculate the intersection of the geometries in each group.
- ST_Aggr_MeanCenter—Calculate the mean center of the geometries in each group.
- ST_Aggr_StdevEllipse—Calculate the standard-deviational ellipse of the geometries in each group.
- ST_Aggr_Union—Calculate the union of the geometries in each group.