Learn how to use Charts Components with Map Components using Vite developer build tools.
In this tutorial, you will:
- Add a map with an arcgis-map component and create a chart with an arcgis-chart component.
- Add an arcgis-charts-action-bar component to the chart that will allow more interaction features with the chart.
- Explore interactive functionalities, such as filtering by extent of the map and synchronizing selections between the chart and the map.
Prerequisites
- The most recent LTS Node.js runtime environment.
- A text editor to edit files.
- A terminal to enter commands.
Steps
Create a new project using Vite
- Download the initial Vite vanilla Javascript project to your local machine.
- Unzip the downloaded file.
- Open the unzipped folder's files in your text editor.
- Navigate to the unzipped folder in your terminal.
Install dependencies
-
Install Charts Components and Map Components in the terminal as dependencies.
Use dark colors for code blocks Copy npm install @arcgis/charts-components @arcgis/map-components -
Start the Vite development server.
Use dark colors for code blocks Copy npm run dev -
Open a web browser and navigate to http://localhost:5173, this webpage will be empty, however, it will update as we proceed through the remaining steps.
-
Import the
arcgis-mapcomponents from the@arcgis/map-componentspackage inmain.js.Use dark colors for code blocks Copy import "@arcgis/map-components/components/arcgis-map"; -
Import functions to define the custom HTML elements from the Charts Components and Calcite Components libraries in
main.js. You will need to use an alias, because the imported function from each library has the same name,define.Custom Elements Use dark colors for code blocks Copy import { defineCustomElements as defineCalciteElements } from "@esri/calcite-components/dist/loader"; import { defineCustomElements as defineChartsElements } from "@arcgis/charts-components/dist/loader"; -
Define the custom elements on the window using the Calcite Components distribution build.
Use dark colors for code blocks Copy defineCalciteElements(); -
Next, define and load all of the custom charts elements.
Use dark colors for code blocks Copy defineChartsElements(window, { resourcesUrl: "https://js.arcgis.com/charts-components/4.32/assets" });
Add styles
-
In style.css, import the
@arcgis/corelight theme CSS stylesheet.Use dark colors for code blocks Copy @import "https://js.arcgis.com/4.32/@arcgis/core/assets/esri/themes/light/main.css"; -
Add CSS styles to make the
html,bodyandarcgis-mapelements the full width and height of their parent containers.Use dark colors for code blocks Copy html, body { margin: 0; } arcgis-map { display: block; height: 100vh; } -
Add CSS styles to the
arcgis-chartelement to position the chart directly on top of the map component.Use dark colors for code blocks Copy arcgis-chart { position: absolute; bottom: 20px; left: 20px; height: 50%; width: 60%; } -
Import the CSS file in
main.js.Use dark colors for code blocks Copy import "./style.css";
Add components
-
Add the
arcgis-mapcomponent toindex.htmlunder<body.> Use dark colors for code blocks Copy <arcgis-map item-id="f2481ef191924872be8897179f73d55c"></arcgis-map> -
Add the
arcgis-chartcomponent under the map component.Use dark colors for code blocks Copy <arcgis-chart></arcgis-chart> -
Add the
arcgis-charts-action-barcomponent to be slotted inside thearcgis-chartcomponent.Use dark colors for code blocks Copy <arcgis-chart> <arcgis-charts-action-bar slot="action-bar"></arcgis-charts-action-bar> </arcgis-chart>
Create a reference to components
- In
main.js, usedocument.queryto get references for theSelector() arcgis-map,arcgis-chartandarcgis-charts-action-barcomponents.Use dark colors for code blocks Copy const mapElement = document.querySelector("arcgis-map"); const chartElement = document.querySelector("arcgis-chart"); const actionBarElement = document.querySelector("arcgis-charts-action-bar");
Load the bar chart
-
Since we are going to use property values from the map component, we'll use the
arcgisevent to determine when the map is ready.View Ready Change Use dark colors for code blocks Copy mapElement.addEventListener("arcgisViewReadyChange", async (event) => { // to be implemented }); -
Inside the event listener, get the
mapandviewfrom the event target.Use dark colors for code blocks Copy const { map, view } = event.target; -
Use
findto get theCollegelayer from the map, and useScorecard load()to ensure the layer loads.Use dark colors for code blocks Copy const featureLayer = map.layers.find((layer) => layer.title === "CollegeScorecard"); await featureLayer.load(); -
Get the first chart configuration from the feature layer
Use dark colors for code blocks Copy const chartConfig = featureLayer.charts[0]; -
Set chart element's
layerproperty to the feature layer first, then assign the chart configuration to the chart element'smodelproperty. Settingmodellast will ensure the chart renders correctly.Use dark colors for code blocks Copy chartElement.layer = featureLayer; chartElement.model = chartConfig;
Synchronize chart selection with map highlights
-
In the
arcgisevent listener, get the layer views from the view.View Ready Change Use dark colors for code blocks Copy const featureLayerViews = view.layerViews; -
Add an event listener to the chart element. When the
arcgisevent is fired, remove the previous selection and highlight the currently selected features on the map.Selection Complete Use dark colors for code blocks Copy chartElement.addEventListener("arcgisSelectionComplete", (event) => { map.highlightSelect?.remove(); map.highlightSelect = featureLayerViews.items[0].highlight(event.detail.selectionData.selectionOIDs); });
Filter chart data by map extent
-
In the
arcgisevent listener's callback function, set theView Ready Change viewof the chart element to the map'sview.Use dark colors for code blocks Copy chartElement.view = view; -
Add the
arcgisevent listener to theDefault Action Select action.Bar Element Use dark colors for code blocks Copy actionBarElement.addEventListener("arcgisDefaultActionSelect", (event) => { // to be implemented }); -
In the
arcgisevent listener's callback function, get theCharts Default Action Select actionandId actionproperties from the event'sActive detailproperty.Use dark colors for code blocks Copy const { actionId, actionActive } = event.detail; -
Set the view of the chart element to the map view if the
Filter By Extentaction is toggled on.Use dark colors for code blocks Copy if (actionId === "filterByExtent") { chartElement.filterByExtent = actionActive; }
Highlight chart data based on map selections
-
Outside of the
arcgisevent listener, add a second event listener to theView Ready Change map:Element arcgis.View Click Use dark colors for code blocks Copy mapElement.addEventListener("arcgisViewClick", (event) => { // to be implemented }); -
In the
arcgisevent listener's callback, get the view from the event target.View Click Use dark colors for code blocks Copy const { view } = event.target; -
Get the screen points from the event's
detailproperty.Use dark colors for code blocks Copy let screenPoints = event.detail.screenPoint; view.hitTest(screenPoints).then(getFeatures); -
Lastly, get the features from the hit test. Within the function, get the selected feature's OID (in this case, the attribute is
Object) and assign it to the chart element's selection data.Id Use dark colors for code blocks Copy function getFeatures(response) { const selectedFeatureOID = response.results[0].graphic.attributes["ObjectId"]; chartElement.selectionData = { selectionOIDs: [selectedFeatureOID], }; }
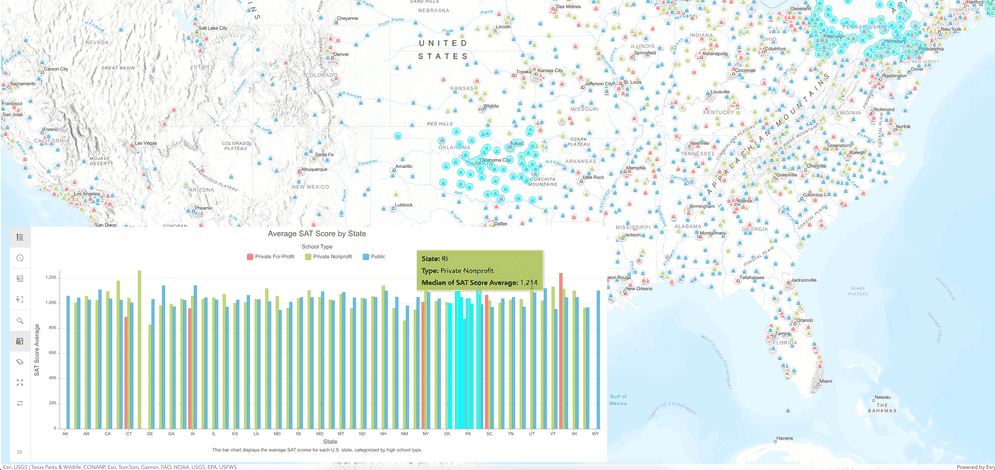
Run the application
The application should display a bar chart overlaying on the map. When you select features on the chart, the corresponding features will be highlighted on the map. With the Filter By Extent action enabled, the bar chart will only show features within the current map extent. Additionally, selecting features on the map will highlight the corresponding features on the chart.