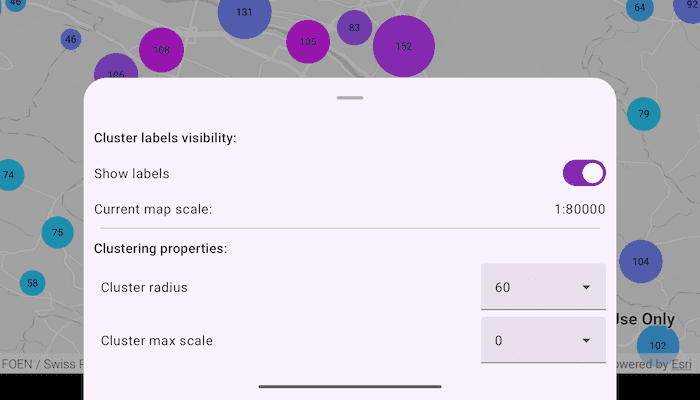
Add client side feature reduction on a point feature layer that is not pre-configured with clustering.

Use case
Feature clustering can be used to dynamically aggregate groups of points that are within proximity of each other in order to represent each group with a single symbol. Such grouping allows you to see patterns in the data that are difficult to visualize when a layer contains hundreds or thousands of points that overlap and cover each other. Users can add feature clustering to point feature layers. This is useful when the layer does not have the feature reduction defined or when the existing feature reduction properties need to be overridden.
How to use the sample
Interact with the controls to customize clustering feature reduction properties. Tap on any clustered aggregate geoelement to see the cluster feature count and aggregate fields in the popup.
How it works
- Create a map from a web map
PortalItem. - Create a
ClassBreaksRendererand define aFieldNameandDefaultSymbol.FieldNamemust be one of the summary fields in theAggregateFieldscollection. - Add
ClassBreakobjects each with an associatedSimpleMarkerSymbolto the renderer. - Create a
ClusteringFeatureReductionusing the renderer. - Add
AggregateFieldobjects to the feature reduction where theFieldNameis the name of the field to aggregate and theStatisticTypeis the type of aggregation to perform. - Define the
minSymbolSizeandmaxSymbolSizefor the feature reduction. If these are not defined they default to 12 and 70 respectively. - Add the
ClusteringFeatureReductionto theFeatureLayer. - Create a
LabelDefinitionwith aSimpleLabelExpressionandTextSymbolto define the cluster label. - Configure a
MapView.onSingleTapConfirmedevent and identify the nearest feature to display feature cluster information in aPopupViewer.
Relevant API
- AggregateGeoElement
- ClassBreaksRenderer
- FeatureLayer
- FeatureReduction
- GeoElement
- IdentifyLayerResult
- PopupViewer
About the data
This sample uses a web map that displays residential data for Zurich, Switzerland.
Additional information
This sample uses the GeoViewCompose Toolkit module to be able to implement a Composable MapView.
Tags
aggregate, bin, cluster, geoviewcompose, group, merge, normalize, popup, reduce, renderer, summarize, toolkit
Sample Code
/* Copyright 2024 Esri
*
* Licensed under the Apache License, Version 2.0 (the "License");
* you may not use this file except in compliance with the License.
* You may obtain a copy of the License at
*
* http://www.apache.org/licenses/LICENSE-2.0
*
* Unless required by applicable law or agreed to in writing, software
* distributed under the License is distributed on an "AS IS" BASIS,
* WITHOUT WARRANTIES OR CONDITIONS OF ANY KIND, either express or implied.
* See the License for the specific language governing permissions and
* limitations under the License.
*
*/
package com.esri.arcgismaps.sample.configureclusters
import android.os.Bundle
import androidx.activity.ComponentActivity
import androidx.activity.compose.setContent
import androidx.compose.material3.MaterialTheme
import androidx.compose.material3.Surface
import androidx.compose.runtime.Composable
import com.arcgismaps.ApiKey
import com.arcgismaps.ArcGISEnvironment
import com.esri.arcgismaps.sample.configureclusters.screens.MainScreen
import com.esri.arcgismaps.sample.sampleslib.theme.SampleAppTheme
class MainActivity : ComponentActivity() {
override fun onCreate(savedInstanceState: Bundle?) {
super.onCreate(savedInstanceState)
// authentication with an API key or named user is
// required to access basemaps and other location services
ArcGISEnvironment.apiKey = ApiKey.create(BuildConfig.ACCESS_TOKEN)
setContent {
SampleAppTheme {
ConfigureClustersApp()
}
}
}
@Composable
private fun ConfigureClustersApp() {
Surface(
color = MaterialTheme.colorScheme.background
) {
MainScreen(
sampleName = getString(R.string.configure_clusters_app_name)
)
}
}
}