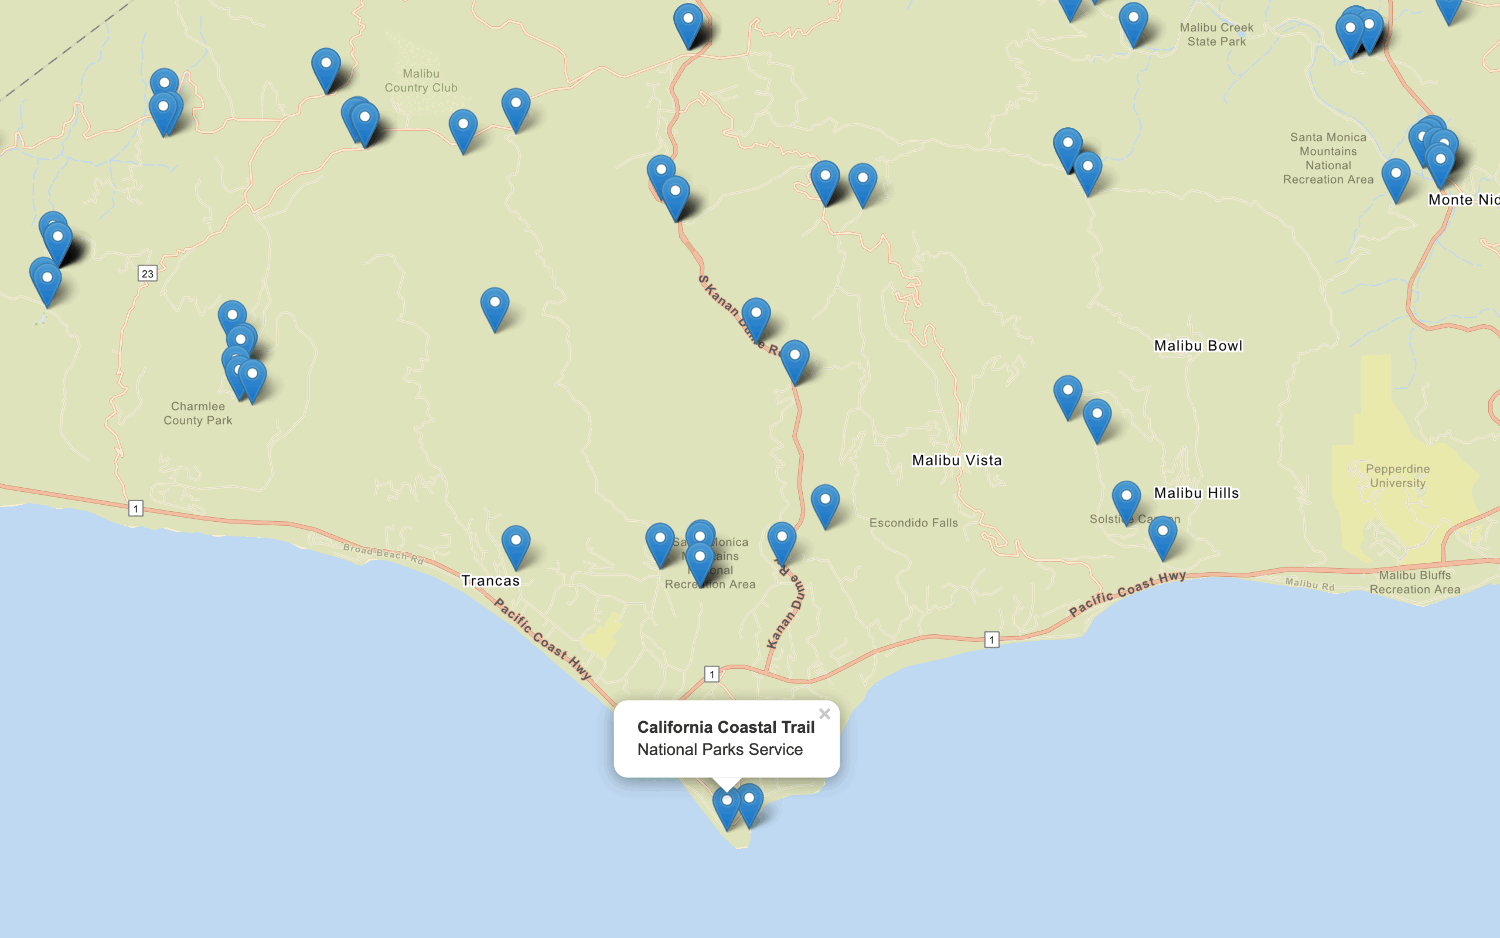
Learn how to add features as GeoJSON to a map.
A feature layer is a dataset in a hosted feature service. Each feature layer contains features with a single geometry type (point, line, or polygon), and a set of attributes. You can access and display features by making query requests to the feature service and displaying them in a map.
In this tutorial, you access the Trailheads feature layer to get GeoJSON and display the features as clusters. Working with GeoJSON is often useful for dynamically generated data, but not suitable for large datasets.
Prerequisites
An ArcGIS Location Platform or ArcGIS Online account.
Steps
Get the starter app
Select a type of authentication below and follow the steps to create a new application.
Set up authentication
Create developer credentials in your portal for the type of authentication you selected.
Set developer credentials
Use the API key or OAuth developer credentials so your application can access location services.
Add a load event handler
You need to wait for the map to be completely loaded before adding any layers.
-
Add an event handler to the map
loadevent.For more information about the
loadevent, see the MapLibre GL JS documentation.Use dark colors for code blocks <script> /* Use for API key authentication */ const accessToken = "YOUR_ACCESS_TOKEN"; // or /* Use for user authentication */ // const session = await arcgisRest.ArcGISIdentityManager.beginOAuth2({ // clientId: "YOUR_CLIENT_ID", // Your client ID from OAuth credentials // redirectUri: "YOUR_REDIRECT_URI", // The redirect URL registered in your OAuth credentials // portal: "YOUR_PORTAL_URL" // Your portal URL // }) // const accessToken = session.token; const basemapEnum = "arcgis/outdoor"; const map = new maplibregl.Map({ container: "map", // the id of the div element style: `https://basemapstyles-api.arcgis.com/arcgis/rest/services/styles/v2/styles/${basemapEnum}?token=${accessToken}`, zoom: 12, // starting zoom center: [-118.805, 34.027] // starting location [longitude, latitude] }); map.once("load", () => { // This code runs once the base style has finished loading. }); // Add Esri attribution // Learn more in https://esriurl.com/attribution map._controls[0].options.customAttribution += " | Powered by Esri " map._controls[0]._updateAttributions() </script>
Add a GeoJSON source
To add GeoJSON from a feature service, you need to define a source of type geojson and reference the feature layer. The source tells MapLibre GL JS how to access the data for the layer, but does not visually add it to the map. To get GeoJSON features from a feature layer, you provide a URL to query the feature service and return features in GeoJSON format. Features can then be displayed by adding the source to a layer.
While there are several types of sources, the two most common are geojson (for a set of features represented as GeoJSON) and vector (for vector tiles). For more information, see the MapLibre Style Specification.
-
Inside the load event handler, add a
source. Set theidtotrailheadsandtypetogeojson. Setdatato the URL for thetrailheadsfeature layer. Appendquery?f=pgeojson&where=1=1to the URL to request all of the features as GeoJSON.Use dark colors for code blocks map.once("load", () => { // This code runs once the base style has finished loading. map.addSource("trailheads", { type: "geojson", data: "https://services3.arcgis.com/GVgbJbqm8hXASVYi/arcgis/rest/services/Trailheads/FeatureServer/0/query?f=pgeojson&where=1=1", }); }); -
Add the data attribution for the feature layer source.
- Go to the Trailheads (Santa Monica Mountains) item.
- Scroll down to the Credits (Attribution) section and copy its value.
- Create an
attributionproperty and paste the attribution value from the item.Use dark colors for code blocks map.once("load", () => { // This code runs once the base style has finished loading. map.addSource("trailheads", { type: "geojson", data: "https://services3.arcgis.com/GVgbJbqm8hXASVYi/arcgis/rest/services/Trailheads/FeatureServer/0/query?f=pgeojson&where=1=1", // Attribution text retrieved from https://arcgis.com/home/item.html?id=883cedb8c9fe4524b64d47666ed234a7 attribution: "Los Angeles GeoHub" }); });
Add a circle layer
A layer in MapLibre GL JS is a visual representation of the data within one source. Use a layer of type circle to display the trailheads.
-
Use
addto add aLayer circlelayer with idtrailheads-circle. Setsourcetotrailheadsto reference the source you just created. Addpaintproperties to make the circles black.The
typeproperty defines how it will be displayed. Commonly used layer types includecircle,line,fillandsymbol(used for text and icons).The
idproperty is an identifier you choose. You will need it if you want to manipulate the layer, such as hiding it or changing its properties dynamically.The
sourceproperty references theidproperty of the source you just created.The
paintproperties control the visual attributes of the layer and are specific to the type of layer.For more information, see the MapLibre Style Specification.
Use dark colors for code blocks map.once("load", () => { // This code runs once the base style has finished loading. map.addSource("trailheads", { type: "geojson", data: "https://services3.arcgis.com/GVgbJbqm8hXASVYi/arcgis/rest/services/Trailheads/FeatureServer/0/query?f=pgeojson&where=1=1", // Attribution text retrieved from https://arcgis.com/home/item.html?id=883cedb8c9fe4524b64d47666ed234a7 attribution: "Los Angeles GeoHub" }); map.addLayer({ id: "trailheads-circle", type: "circle", source: "trailheads", paint: { "circle-color": "hsla(0,0%,0%,0.75)", "circle-stroke-width": 1.5, "circle-stroke-color": "white", } }); }); -
At the top right, click Run to display the basemap with trailheads as black dots.
Use clusters to display points
One benefit of using GeoJSON to load points in MapLibre GL JS is you can use clustering. This technique replaces a number of overlapping points with a single point that represents the cluster. It simplifies the visual appearance of the map by reducing detail, particularly at lower zoom levels.
To enable clustering, you pass additional parameters when defining the source: cluster: true and the optional parameters cluster and cluster.
Points that represent clusters have a cluster property that is set to true. You can use this in your trailheads-circle layer to make those points larger, by using a data-driven expression for circle-radius. You use the case and get expressions for this.
They also have a point attribute which contains the number of points in the cluster. You can display this as a text label, using a symbol layer.
-
Add
cluster,clusterandRadius clusterattributes to the definition of theMax Zoom trailheadssource.Use dark colors for code blocks map.addSource("trailheads", { type: "geojson", data: "https://services3.arcgis.com/GVgbJbqm8hXASVYi/arcgis/rest/services/Trailheads/FeatureServer/0/query?f=pgeojson&where=1=1", cluster: true, clusterRadius: 20, // cluster two trailheads if less than 20 pixels apart clusterMaxZoom: 14, // display all trailheads individually from zoom 14 up // Attribution text retrieved from https://arcgis.com/home/item.html?id=883cedb8c9fe4524b64d47666ed234a7 attribution: "Los Angeles GeoHub" }); -
Make each point larger if it represents a cluster.
Use dark colors for code blocks map.addLayer({ id: "trailheads-circle", type: "circle", source: "trailheads", paint: { "circle-color": "hsla(0,0%,0%,0.75)", "circle-stroke-width": 1.5, "circle-stroke-color": "white", "circle-radius": ["case", ["get", "cluster"], 10, 5] // 10 pixels for clusters, 5 pixels otherwise } }); -
Add a symbol layer,
trailheads-cluster-count. Use the attributepointas the value for_count text-field.Use dark colors for code blocks paint: { "circle-color": "hsla(0,0%,0%,0.75)", "circle-stroke-width": 1.5, "circle-stroke-color": "white", "circle-radius": ["case", ["get", "cluster"], 10, 5] // 10 pixels for clusters, 5 pixels otherwise } }); map.addLayer({ id: "trailheads-cluster-count", type: "symbol", source: "trailheads", layout: { "text-font": ["Arial Bold"], "text-field": ["get", "point_count"], "text-offset": [0, 0.1] // move the label vertically downwards slightly to improve centering }, paint: { "text-color": "white" } });
Run the app
Run the app.
The map should display the trailheads as clusters with a number on a large circle. Zoom in to see the clusters split into smaller clusters, and eventually split into single trailhead features.What's next?
Learn how to use additional ArcGIS location services in these tutorials:

Query a feature layer (SQL)
Execute a SQL query to access polygon features from a feature layer.

Query a feature layer (spatial)
Execute a spatial query to access polygon features from a feature service.

Style a feature layer
Use data-driven styling to apply symbol colors and styles to feature layers.

Display a pop-up
Display feature attributes in a popup.