Learn how to add a map tile layer to a map.
A map tile layer, also known as an image tile layer, displays raster imagery such as satellite photography or hillshading. You can combine map tile layers to enhance the display of a street basemap layer, position the layer on top of existing layers, or position it under existing layers. When positioned above other layers, you need to give the map tile layer a level of transparency so that users can see through it to the basemap. This combined basemap layer technique is used to enhance overall visualization.
In this tutorial, you add a Santa Monica contours map tile layer, which is a basemap layer composed of JPEG images, on top of a street basemap layer.
Prerequisites
An ArcGIS Location Platform or ArcGIS Online account.
Steps
Get the starter app
Select a type of authentication below and follow the steps to create a new application.
Set up authentication
Create developer credentials in your portal for the type of authentication you selected.
Set developer credentials
Use the API key or OAuth developer credentials so your application can access location services.
Update the map
-
Center the map on
[-118.44, 34.03]and set the zoom level to 11. This will set the map focus to Santa Monica, California.Use dark colors for code blocks <script> /* Use for API key authentication */ const accessToken = "YOUR_ACCESS_TOKEN"; // or /* Use for user authentication */ // const session = await arcgisRest.ArcGISIdentityManager.beginOAuth2({ // clientId: "YOUR_CLIENT_ID", // Your client ID from OAuth credentials // redirectUri: "YOUR_REDIRECT_URI", // The redirect URL registered in your OAuth credentials // portal: "YOUR_PORTAL_URL" // Your portal URL // }) // const accessToken = session.token; const basemapEnum = "arcgis/light-gray"; const map = new maplibregl.Map({ container: "map", // the id of the div element style: `https://basemapstyles-api.arcgis.com/arcgis/rest/services/styles/v2/styles/${basemapEnum}?token=${accessToken}`, zoom: 11, // starting zoom center: [-118.44, 34.03] // starting location [longitude, latitude] }); // Add Esri attribution // Learn more in https://esriurl.com/attribution map._controls[0].options.customAttribution += " | Powered by Esri " map._controls[0]._updateAttributions() </script>
Add a load event handler
To add layers to the map, you need to use the load event to ensure the map is fully loaded.
-
Add an event handler for the
loadevent.For more information about the
loadevent, see the MapLibre GL JS documentation.Use dark colors for code blocks <script> /* Use for API key authentication */ const accessToken = "YOUR_ACCESS_TOKEN"; // or /* Use for user authentication */ // const session = await arcgisRest.ArcGISIdentityManager.beginOAuth2({ // clientId: "YOUR_CLIENT_ID", // Your client ID from OAuth credentials // redirectUri: "YOUR_REDIRECT_URI", // The redirect URL registered in your OAuth credentials // portal: "YOUR_PORTAL_URL" // Your portal URL // }) // const accessToken = session.token; const basemapEnum = "arcgis/light-gray"; const map = new maplibregl.Map({ container: "map", // the id of the div element style: `https://basemapstyles-api.arcgis.com/arcgis/rest/services/styles/v2/styles/${basemapEnum}?token=${accessToken}`, zoom: 11, // starting zoom center: [-118.44, 34.03] // starting location [longitude, latitude] }); map.once("load", () => { // This code runs once the base style has finished loading. }); // Add Esri attribution // Learn more in https://esriurl.com/attribution map._controls[0].options.customAttribution += " | Powered by Esri " map._controls[0]._updateAttributions() </script>
Add a raster source
You need to define a source for the map tiles. This tells the Map how to access the data for the layer, but does not display it.
-
Inside the load event handler, add a raster source with id
contours.While there are several types of source, the most common are
vectorfor vector tiles,rasterfor map tiles, andgeojsonfor a set of features represented as GeoJSON.For more information, see the MapLibre Style Specification
Use dark colors for code blocks map.once("load", () => { // This code runs once the base style has finished loading. map.addSource("contours", { type: "raster", tiles: [ "https://services3.arcgis.com/GVgbJbqm8hXASVYi/arcgis/rest/services/Santa_Monica_contours_(map_tiles)/MapServer/tile/{z}/{y}/{x}?token=" + accessToken ], }); }); -
Add the data attribution for the map tile source.
- Go to the Santa Monica Mountains countours item.
- Scroll down to the Credits (Attribution) section and copy its value.
- Create an
attributionproperty and paste the attribution value from the item.Use dark colors for code blocks map.once("load", () => { // This code runs once the base style has finished loading. map.addSource("contours", { type: "raster", tiles: [ "https://services3.arcgis.com/GVgbJbqm8hXASVYi/arcgis/rest/services/Santa_Monica_contours_(map_tiles)/MapServer/tile/{z}/{y}/{x}?token=" + accessToken ], // Attribution text retrieved from https://arcgis.com/home/item.html?id=5fd812155876416997c1a03e841e8821 attribution: 'City of Santa Monica GIS Data' }); });
Add a raster layer
To display the map tiles, add a layer of type raster.
A layer in MapLibre GL JS is a visual representation of the data within one source
For more information, see the MapLibre Style Specification.
-
Add a raster layer with id
contours-raster, connected to thecontourssource.Use dark colors for code blocks map.once("load", () => { // This code runs once the base style has finished loading. map.addSource("contours", { type: "raster", tiles: [ "https://services3.arcgis.com/GVgbJbqm8hXASVYi/arcgis/rest/services/Santa_Monica_contours_(map_tiles)/MapServer/tile/{z}/{y}/{x}?token=" + accessToken ], // Attribution text retrieved from https://arcgis.com/home/item.html?id=5fd812155876416997c1a03e841e8821 attribution: 'City of Santa Monica GIS Data' }); map.addLayer( { id: "contours-raster", type: "raster", source: "contours" }, ); }); -
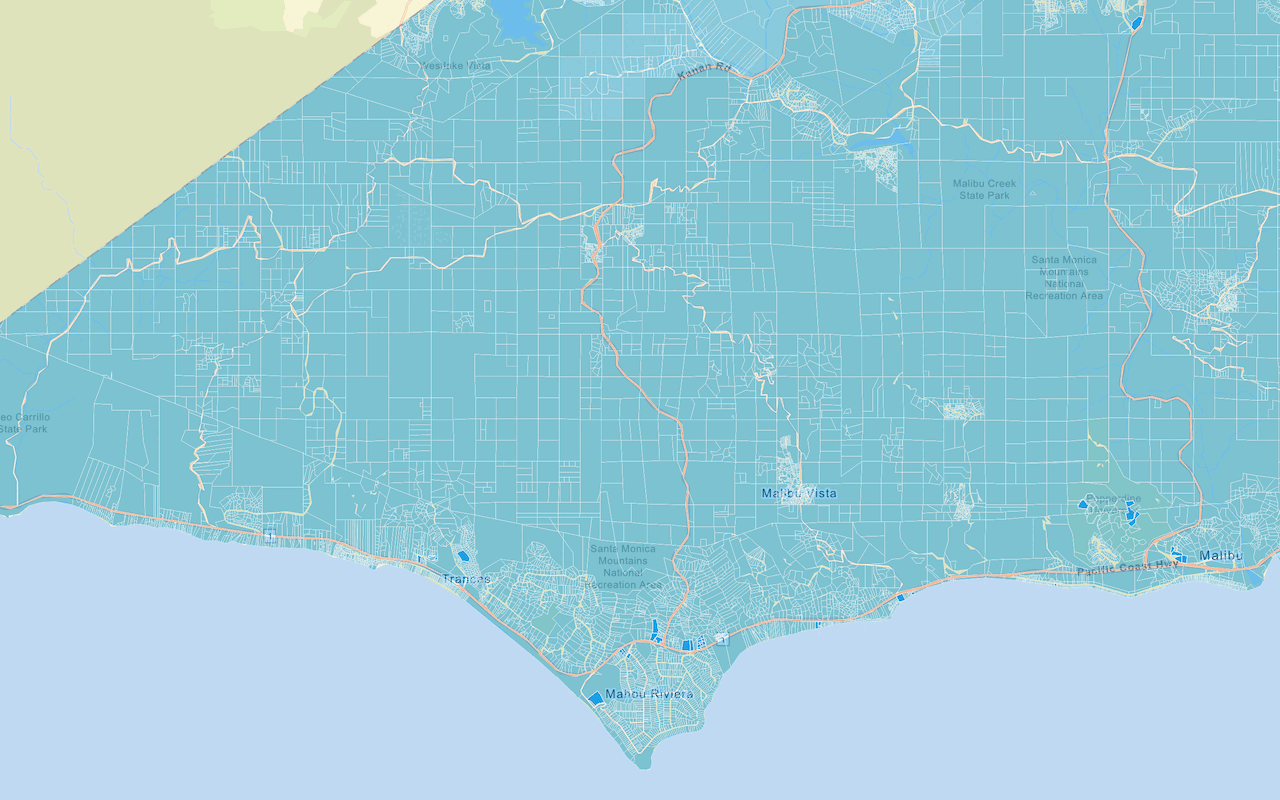
At the top right, click Run. You should see the contours layer only.
Adjust the basemap
By default, the contours layer is added on top of all the basemap layers. To visually combine contours with roads and park layers, you need to make two changes.
-
Move the contours layer below every layer except the background layer. You do this by passing the id of the next layer as an extra argument to
map.add.Layer -
Reduce the opacity of basemap elements so the contours layer can be seen through them. In the
ArcGISbasemap, this includes several layers whose ids begin with:Streets Water area,Marine area,BathymetryorBuilding. You can usemap.getto get the current style, and itsStyle layersproperty to access all layers. Usemap.setto change thePaint Property fill-opacityfor each layer. -
In the load handler, find the id of the first non-background layer. Modify your
addcall to insert the raster layer before that layer.Layer Use dark colors for code blocks // Find the first non-background layer in order to add our raster layer before it. const layers = map.getStyle().layers; const bottomLayer = layers.find((layer) => layer.type !== "background"); map.addLayer( { id: "contours-raster", type: "raster", source: "contours" }, bottomLayer.id ); -
Set 50%
fill-opacityfor every fill layer except water and building layers.Use dark colors for code blocks bottomLayer.id ); layers.forEach((layer) => { if (layer.type === "fill" && !layer.id.match(/(Water area|Marine area|Bathymetry|Building)/)) { map.setPaintProperty(layer.id, "fill-opacity", 0.5); } });
Run the app
Run the app.
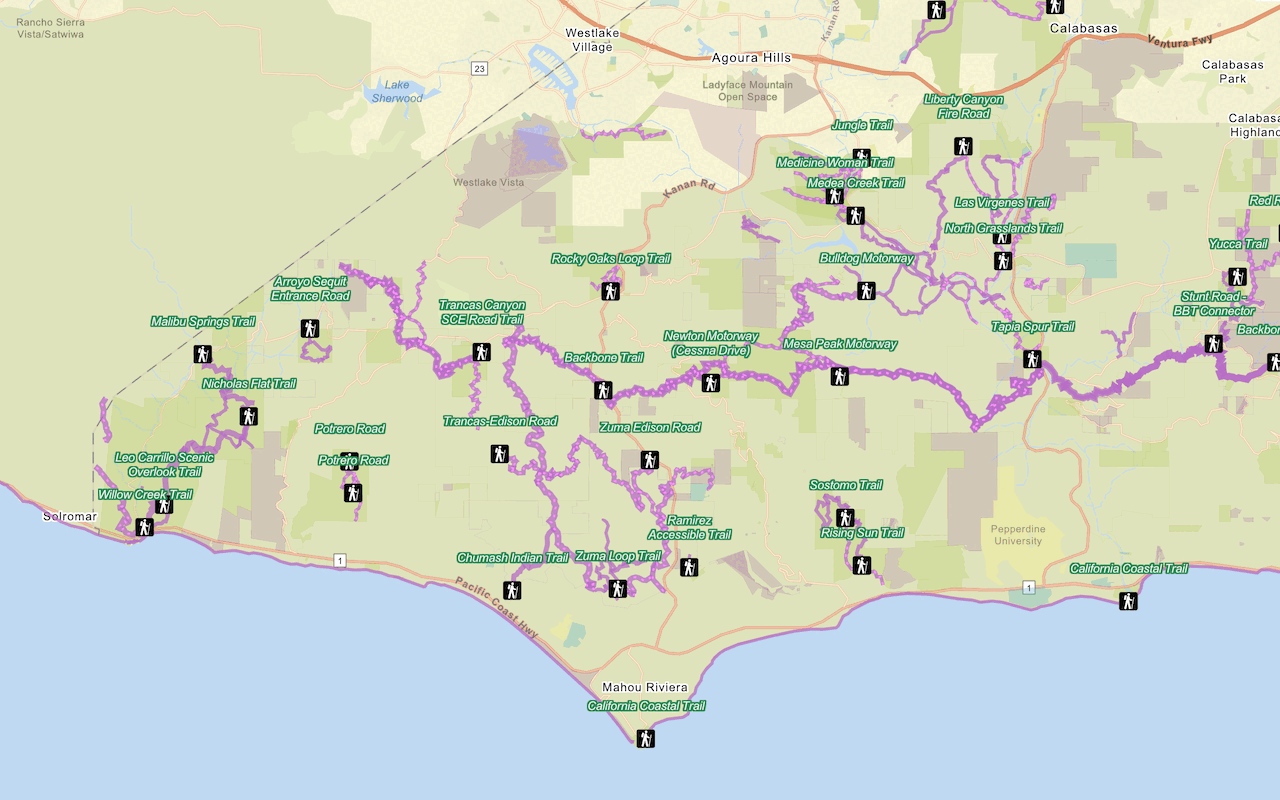
Your map should display a semi-transparent contours layer overlaid over a basemap. You should see the contours layer combined with other layers, with labels, roads, buildings and water areas clearly visible over the top.What's next?
Learn how to use additional ArcGIS location services in these tutorials:


