Learn how to display feature attributes in a popup.
A popup, also known as a "popup", is a visual element that displays information about a feature when it is clicked. You typically style and configure a popup using HTML and CSS for each layer in a map. popups can display attribute values, calculated values, or rich content such as images, charts, or videos.
In this tutorial, you create an interactive popup for the Trailheads vector tile layer in the Santa Monica Mountains. When a feature is clicked, a popup is displayed containing the name of the trail and the service that manages it.
Prerequisites
An ArcGIS Location Platform or ArcGIS Online account.
Steps
Get the starter app
Select a type of authentication below and follow the steps to create a new application.
Set up authentication
Create developer credentials in your portal for the type of authentication you selected.
Set developer credentials
Use the API key or OAuth developer credentials so your application can access location services.
Add a load handler
You need to wait for the map to be completely loaded before adding any layers.
-
Add an event handler to the map
loadevent.Use dark colors for code blocks <script> /* Use for API key authentication */ const accessToken = "YOUR_ACCESS_TOKEN"; // or /* Use for user authentication */ // const session = await arcgisRest.ArcGISIdentityManager.beginOAuth2({ // clientId: "YOUR_CLIENT_ID", // Your client ID from OAuth credentials // redirectUri: "YOUR_REDIRECT_URI", // The redirect URL registered in your OAuth credentials // portal: "YOUR_PORTAL_URL" // Your portal URL // }) // const accessToken = session.token; const basemapEnum = "arcgis/outdoor"; const map = new maplibregl.Map({ container: "map", // the id of the div element style: `https://basemapstyles-api.arcgis.com/arcgis/rest/services/styles/v2/styles/${basemapEnum}?token=${accessToken}`, zoom: 12, // starting zoom center: [-118.805, 34.027] // starting location [longitude, latitude] }); map.once("load", () => { }); // Add Esri attribution // Learn more in https://esriurl.com/attribution map._controls[0].options.customAttribution += " | Powered by Esri " map._controls[0]._updateAttributions() </script>
Add the trailheads layer
You will use a vector tile source and a circle layer to display the trailheads.
-
Inside the load handler, add a source called
trailheadsand set theurlproperty of the vector tile layer.Use dark colors for code blocks map.once("load", () => { map.addSource("trailheads", { type: "vector", tiles: [ "https://vectortileservices3.arcgis.com/GVgbJbqm8hXASVYi/arcgis/rest/services/Trailheads/VectorTileServer/tile/{z}/{y}/{x}.pbf" ], }); }); -
Add the data attribution for the vector tile source.
- Go to the Trailheads (Santa Monica Mountains) item.
- Scroll down to the Credits (Attribution) section and copy its value.
- Create an
attributionproperty and paste the attribution value from the item.Use dark colors for code blocks map.once("load", () => { map.addSource("trailheads", { type: "vector", tiles: [ "https://vectortileservices3.arcgis.com/GVgbJbqm8hXASVYi/arcgis/rest/services/Trailheads/VectorTileServer/tile/{z}/{y}/{x}.pbf" ], // Attribution text retrieved from https://arcgis.com/home/item.html?id=883cedb8c9fe4524b64d47666ed234a7 attribution: "Los Angeles GeoHub" }); });
-
Add a
circlelayer calledtrailheads-circle, which references thetrailheadssource.Use dark colors for code blocks map.once("load", () => { map.addSource("trailheads", { type: "vector", tiles: [ "https://vectortileservices3.arcgis.com/GVgbJbqm8hXASVYi/arcgis/rest/services/Trailheads/VectorTileServer/tile/{z}/{y}/{x}.pbf" ], // Attribution text retrieved from https://arcgis.com/home/item.html?id=883cedb8c9fe4524b64d47666ed234a7 attribution: "Los Angeles GeoHub" }); map.addLayer({ id: "trailheads-circle", type: "circle", source: "trailheads", "source-layer": "Trailheads", paint: { "circle-color": "hsla(200,80%,70%,0.5)", "circle-stroke-width": 2, "circle-radius": 5, "circle-stroke-color": "hsl(200,80%,50%)" } }); });
Add a click handler
To display a popup appear when a trailheads feature is clicked, add a click event handler. This handler is called with the features under the pointer where you clicked.
-
Add a handler for the
clickevent on theMap. Pass thetrailheads-circleid to theonmethod so the handler is only called when you click on that layer. Inside, store the first element of thefeaturesproperty to atrailheadvariable.If there are multiple overlapping features where you click, all of those features will be included in the
featuresarray. The first element listed will be the topmost feature.See the MapLibre GL JS documentation for more map events you can respond to.
Use dark colors for code blocks paint: { "circle-color": "hsla(200,80%,70%,0.5)", "circle-stroke-width": 2, "circle-radius": 5, "circle-stroke-color": "hsl(200,80%,50%)" } }); map.on("click", "trailheads-circle", (e) => { const trailhead = e.features[0]; });
Create the popup
You create a new Popup with mapboxgl.. The default parameters give a simple white bubble which stays open until you click its close button or somewhere on the map.
To add content, you use Popup.set. Use your trailhead variable to make the HTML string. It is a GeoJSON object, so the clicked trailhead's attributes are in a properties object. The name of the trail is stored in TRL and the name of the park service is in PARK.
-
Create a new
Popup.You can pass additional options, to change behavior such as whether there is a close button in the corner. See the MapLibre documentation for more details.
Use dark colors for code blocks map.on("click", "trailheads-circle", (e) => { const trailhead = e.features[0]; new maplibregl.Popup() }); -
Use
Popup.setto set the contents: the name of the trail in anHTML <h3tag, then the name of the park service.> Use dark colors for code blocks new maplibregl.Popup() .setHTML(`<b>${trailhead.properties.TRL_NAME}</b><br>${trailhead.properties.PARK_NAME}`)
Add the popup to the map
When you create the Popup, it is not immediately added to the map. You need to call set to provide the position, then add to attach it to the Map.
-
Set the location of the
Popupto the location of the feature clicked on by using thesetmethod, then add it to the map.Lng Lat Use dark colors for code blocks new maplibregl.Popup() .setHTML(`<b>${trailhead.properties.TRL_NAME}</b><br>${trailhead.properties.PARK_NAME}`) .setLngLat(trailhead.geometry.coordinates) .addTo(map);
Change the cursor on hover
To indicate that you can interact with a layer by clicking, it is useful to change the mouse cursor to a pointing hand when hovering over the layer. You use Map.get to access the map's <canvas element, so you can set the CSS cursor property.
-
Add a handler to the
mouseenterevent, changing the cursor to a pointer.Use dark colors for code blocks map.on("click", "trailheads-circle", (e) => { const trailhead = e.features[0]; new maplibregl.Popup() .setHTML(`<b>${trailhead.properties.TRL_NAME}</b><br>${trailhead.properties.PARK_NAME}`) .setLngLat(trailhead.geometry.coordinates) .addTo(map); }); map.on("mouseenter", "trailheads-circle", () => { map.getCanvas().style.cursor = "pointer"; }); -
Add a handler to the
mouseleaveevent, changing the cursor back to the default.Use dark colors for code blocks map.on("mouseenter", "trailheads-circle", () => { map.getCanvas().style.cursor = "pointer"; }); map.on("mouseleave", "trailheads-circle", () => { map.getCanvas().style.cursor = ""; });
Run the app
Run the app.
The map view should display the Trailheads feature layer. When you hover over a feature the cursor should change. When you click a feature, the name of the trailhead and its park name is displayed in a popup.What's next?
Learn how to use additional ArcGIS location services in these tutorials:

Query a feature layer (spatial)
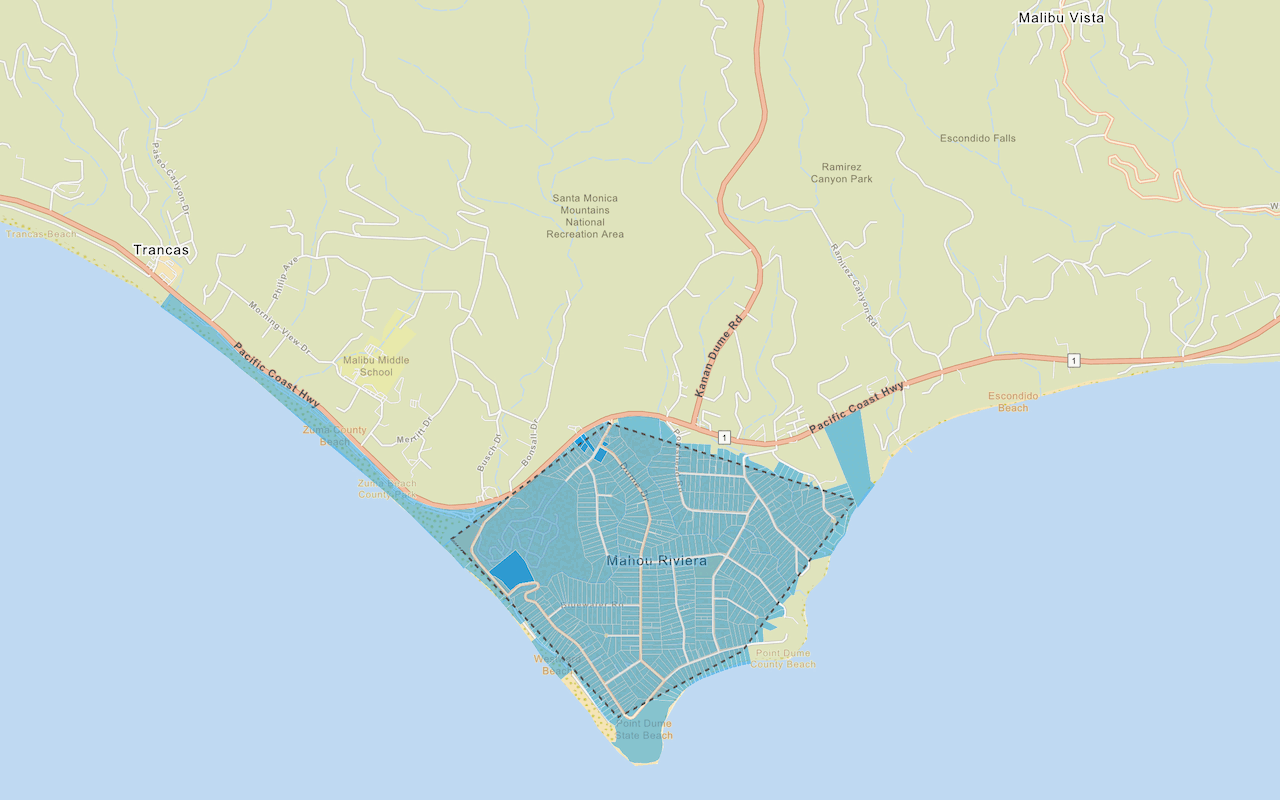
Execute a spatial query to access polygon features from a feature service.

Get global data
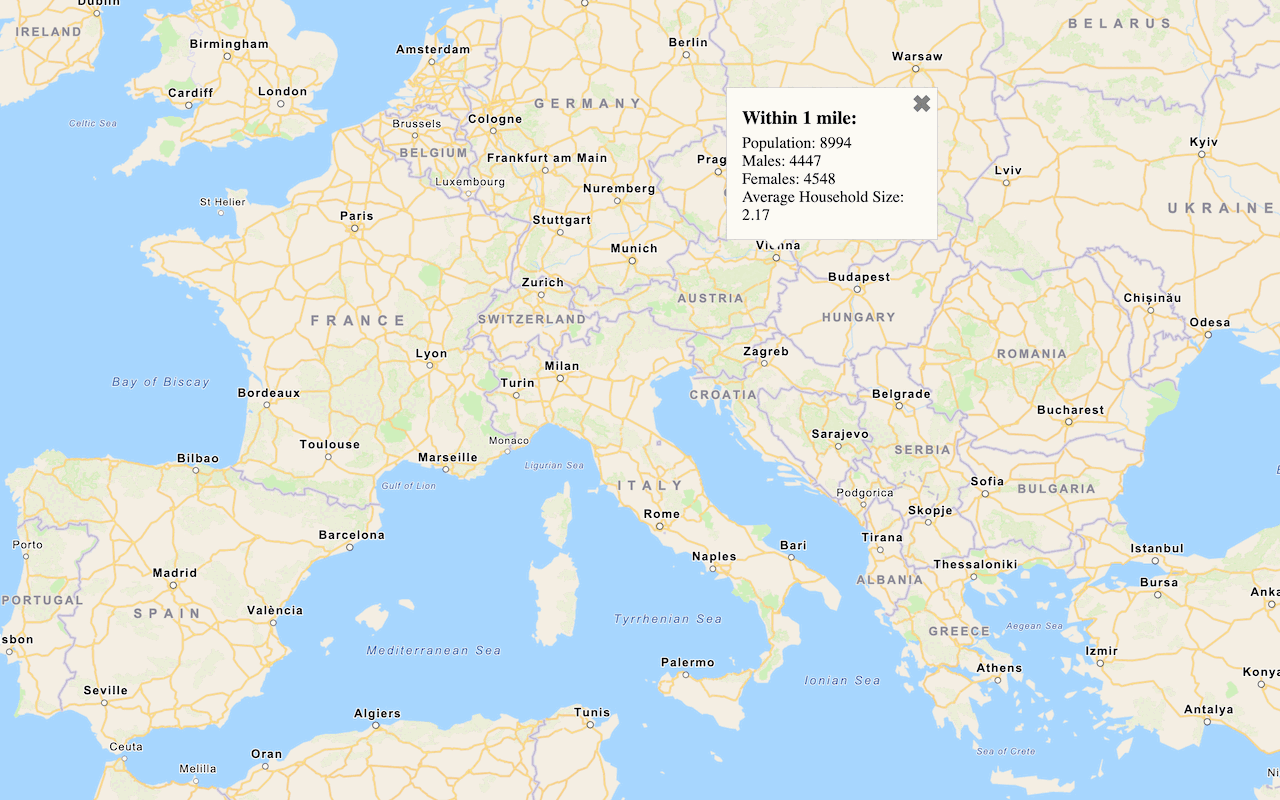
Query demographic information for locations around the world with the GeoEnrichment service.

Get local data
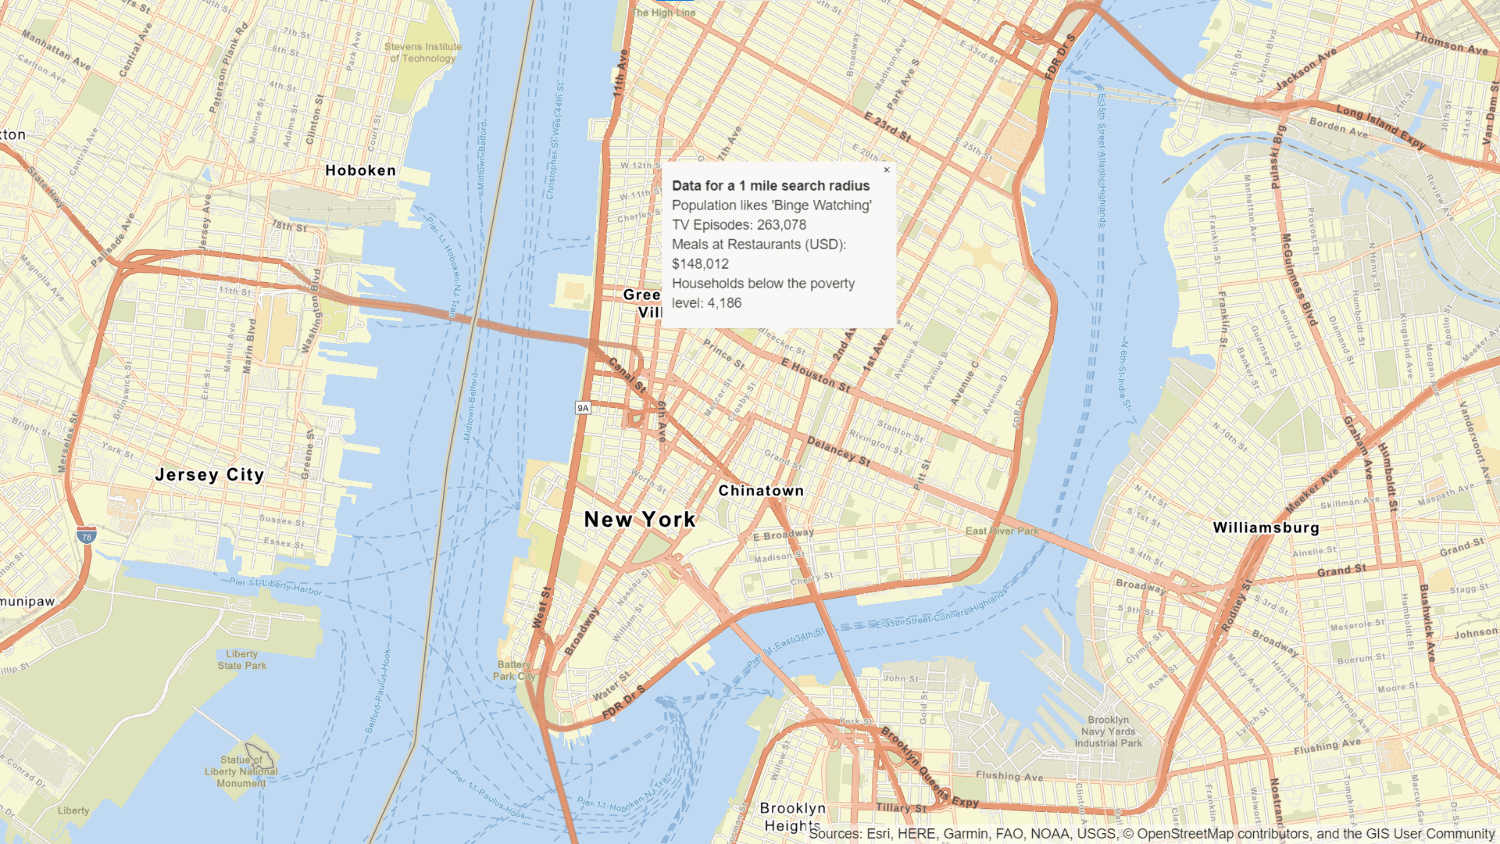
Query regional facts, spending trends, and psychographics with the GeoEnrichment service.

Add a feature layer
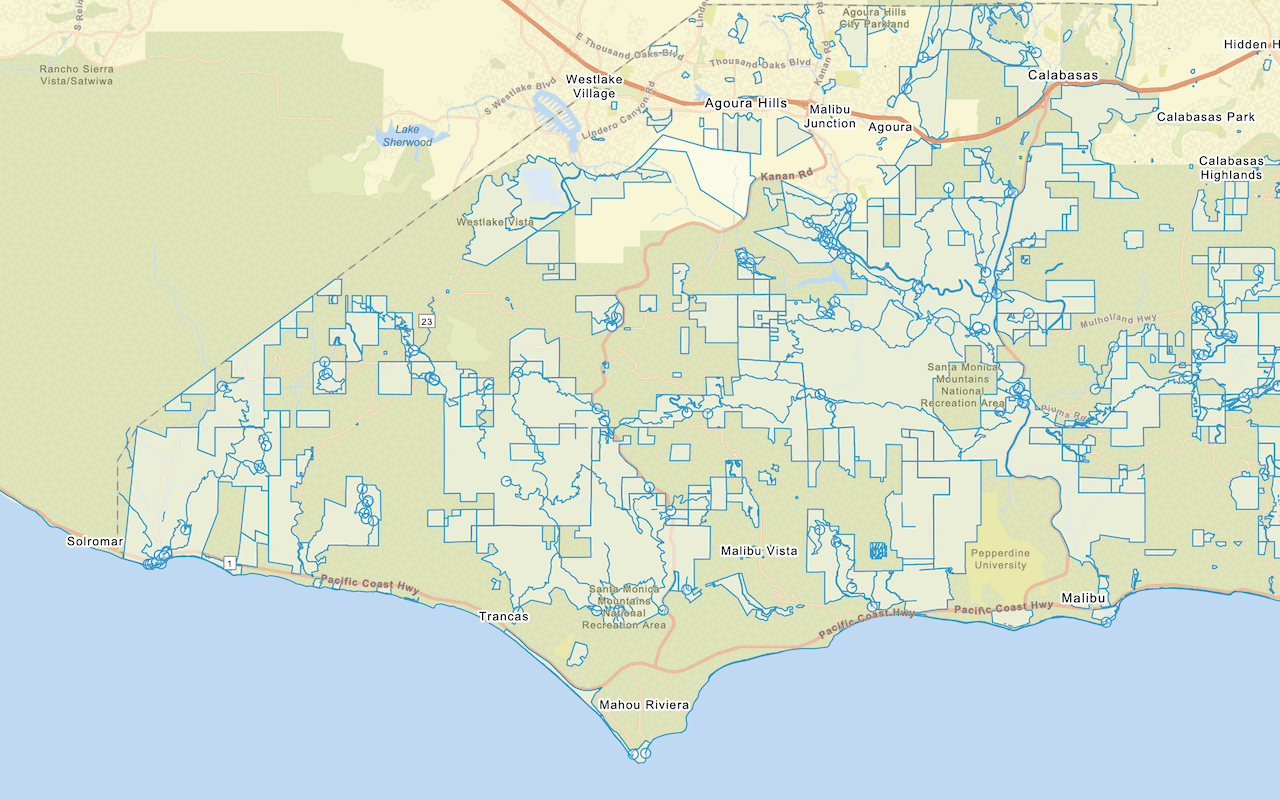
Add features from feature layers to a map.