Style a feature layer

Learn how to use data-driven styling to apply symbol colors and styles to feature layers.

A feature layer is a dataset in a feature service hosted in ArcGIS. Each feature layer contains features with a single geometry type (point, line, or polygon), and a set of attributes. A feature layer can be styled in MapLibre GL JS with a layer connected to a GeoJSON source. Layers can contain expressions which use attribute values to calculate values. This lets you create complex, data-driven visualizations by relating visual variables to data attributes.

In this tutorial, you use symbol, line and fill layers to style three hosted feature layers in ArcGIS.

Prerequisites

You need an ArcGIS Location Platform or ArcGIS Online account.

Steps

Create a new pen

  1. To get started, either complete the Display a map tutorial or .

Get an access token

You need an access token with the correct privileges to access the resources used in this tutorial.

  1. Go to the Create an API key tutorial and create an API key with the following privilege(s):

    • Privileges
      • Location services > Basemaps
    • Item access
      • Note: If you are using your own custom data layer for this tutorial, you need to grant the API key credentials access to the layer item. Learn more in Item access privileges.
  2. Copy the API key access token to your clipboard when prompted.

  3. In CodePen, update the accessToken variable to use your access token.

    Use dark colors for code blocks
    1
    2
    3
    4
    5
    6
    7
    8
    9
    10
    11
    12
    13
    14
    15
    16
    17
    18
    19
    const accessToken = "YOUR_ACCESS_TOKEN";
    const basemapEnum = "arcgis/streets";
    const map = new maplibregl.Map({
      container: "map", // the id of the div element
      style: `https://basemapstyles-api.arcgis.com/arcgis/rest/services/styles/v2/styles/${basemapEnum}?token=${accessToken}`,
      zoom: 12, // starting zoom
      center: [-118.805, 34.027] // starting location [longitude, latitude]
    });
    

To learn about the other types of authentication available, go to Types of authentication.

Load a hiker icon

To use an image as an icon, you must first load the image into the map style using map.loadImage and map.addImage.

  1. Call map.loadImage with 'https://static.arcgis.com/images/Symbols/NPS/npsPictograph_0231b.png' as the first parameter. The second parameter is a callback taking an error and the image.

    Expand
    Use dark colors for code blocks
    1
    2
    3
    4
    5
    6
    7
    8
    9
    10
    11
    12
    13
    14
    15
    16
    17
    18
    19
    20
    21
    22
    23
    24
    25
    26
    27
    28
    29
    30
    31
    32
    33
    34
    35
    36
    37
    38
    39
    40
    41
    42
    43
    44
    45
    46
    47
    48
    49
    50
    51
    52
    53
    54
    55
    56
    57
    58
    59
    60
    61
    62
    63
    64
    65
    66
    67
    68
    69
    70
    71
    72
    73
    74
    75
    76
    77
    78
    79
    80
    81
    82
    83
    84
    85
    86
    87
    88
    89
    90
    91
    92
    93
    94
    95
    96
    97
    98
    99
    100
    101
    102
    103
    104
    105
    106
    107
    108
    109
    110
    111
    112
    113
    114
    115
    116
    117
    118
    119
    120
    121
    122
    123
    124
    125
    126
    127
    128
    129
    130
    131
    132
    133
    134
    135
    136
    137
    138
    139
    140
    141
    142
    143
    144
    145
    146
    147
    148
    149
    150
    151
    152
    153
    154
    155
    156
    157
    158
    159
    160
    161
    162
    163
    164
    165
    166
    167
    168
    169
    170
    171
    172
    173
    174
    175
    176
    177
    178
    179
    180
          const map = new maplibregl.Map({
            container: "map", // the id of the div element
            style: `https://basemapstyles-api.arcgis.com/arcgis/rest/services/styles/v2/styles/${basemapEnum}?token=${accessToken}`,
            zoom: 12, // starting zoom
            center: [-118.805, 34.027] // starting location [longitude, latitude]
          });
    
          map.loadImage("https://static.arcgis.com/images/Symbols/NPS/npsPictograph_0231b.png", (error, image) => {
    
          });
    
    Expand
  2. Call map.addImage to define hiker-icon as the provided image.

    Expand
    Use dark colors for code blocks
    1
    2
    3
    4
    5
    6
    7
    8
    9
    10
    11
    12
    13
    14
    15
    16
    17
    18
    19
    20
    21
    22
    23
    24
    25
    26
    27
    28
    29
    30
    31
    32
    33
    34
    35
    36
    37
    38
    39
    40
    41
    42
    43
    44
    45
    46
    47
    48
    49
    50
    51
    52
    53
    54
    55
    56
    57
    58
    59
    60
    61
    62
    63
    64
    65
    66
    67
    68
    69
    70
    71
    72
    73
    74
    75
    76
    77
    78
    79
    80
    81
    82
    83
    84
    85
    86
    87
    88
    89
    90
    91
    92
    93
    94
    95
    96
    97
    98
    99
    100
    101
    102
    103
    104
    105
    106
    107
    108
    109
    110
    111
    112
    113
    114
    115
    116
    117
    118
    119
    120
    121
    122
    123
    124
    125
    126
    127
    128
    129
    130
    131
    132
    133
    134
    135
    136
    137
    138
    139
    140
    141
    142
    143
    144
    145
    146
    147
    148
    149
    150
    151
    152
    153
    154
    155
    156
    157
    158
    159
    160
    161
    162
    163
    164
    165
    166
    167
    168
    169
    170
    171
    172
    173
    174
    175
    176
    177
    178
    179
    180
          map.loadImage("https://static.arcgis.com/images/Symbols/NPS/npsPictograph_0231b.png", (error, image) => {
    
            if (error) {
              throw error;
            }
            map.addImage("hiker-icon", image);
    
          });
    
    Expand

Style and display trailheads with a hiker icon and labels

To display an icon of a hiker for each trailhead, along with a label, you can use a single symbol layer. Properties for the label start with text- and properties for the icon start with icon-.

  1. Create a function called showTrailheads. Inside, add a GeoJSON source.

    Expand
    Use dark colors for code blocks
    1
    2
    3
    4
    5
    6
    7
    8
    9
    10
    11
    12
    13
    14
    15
    16
    17
    18
    19
    20
    21
    22
    23
    24
    25
    26
    27
    28
    29
    30
    31
    32
    33
    34
    35
    36
    37
    38
    39
    40
    41
    42
    43
    44
    45
    46
    47
    48
    49
    50
    51
    52
    53
    54
    55
    56
    57
    58
    59
    60
    61
    62
    63
    64
    65
    66
    67
    68
    69
    70
    71
    72
    73
    74
    75
    76
    77
    78
    79
    80
    81
    82
    83
    84
    85
    86
    87
    88
    89
    90
    91
    92
    93
    94
    95
    96
    97
    98
    99
    100
    101
    102
    103
    104
    105
    106
    107
    108
    109
    110
    111
    112
    113
    114
    115
    116
    117
    118
    119
    120
    121
    122
    123
    124
    125
    126
    127
    128
    129
    130
    131
    132
    133
    134
    135
    136
    137
    138
    139
    140
    141
    142
    143
    144
    145
    146
    147
    148
    149
    150
    151
    152
    153
    154
    155
    156
    157
    158
    159
    160
    161
    162
    163
    164
    165
    166
    167
    168
    169
    170
    171
    172
    173
    174
    175
    176
    177
    178
    179
    180
          map.loadImage("https://static.arcgis.com/images/Symbols/NPS/npsPictograph_0231b.png", (error, image) => {
    
            if (error) {
              throw error;
            }
            map.addImage("hiker-icon", image);
    
          });
    
          function showTrailheads() {
    
            const trailheadsLayerName = "Trailheads";
            const trailheadsLayerURL =
              "https://services3.arcgis.com/GVgbJbqm8hXASVYi/arcgis/rest/services/" +
              trailheadsLayerName +
              "/FeatureServer/0/query?where=1%3D1&outFields=*&returnGeometry=true&f=pgeojson";
            map.addSource("trailheads", {
              type: "geojson",
              data: trailheadsLayerURL
            });
    
          }
    
    Expand
  2. Add a symbol layer for the hiker icons. Use icon-image to reference the icon you loaded.

    Expand
    Use dark colors for code blocks
    1
    2
    3
    4
    5
    6
    7
    8
    9
    10
    11
    12
    13
    14
    15
    16
    17
    18
    19
    20
    21
    22
    23
    24
    25
    26
    27
    28
    29
    30
    31
    32
    33
    34
    35
    36
    37
    38
    39
    40
    41
    42
    43
    44
    45
    46
    47
    48
    49
    50
    51
    52
    53
    54
    55
    56
    57
    58
    59
    60
    61
    62
    63
    64
    65
    66
    67
    68
    69
    70
    71
    72
    73
    74
    75
    76
    77
    78
    79
    80
    81
    82
    83
    84
    85
    86
    87
    88
    89
    90
    91
    92
    93
    94
    95
    96
    97
    98
    99
    100
    101
    102
    103
    104
    105
    106
    107
    108
    109
    110
    111
    112
    113
    114
    115
    116
    117
    118
    119
    120
    121
    122
    123
    124
    125
    126
    127
    128
    129
    130
    131
    132
    133
    134
    135
    136
    137
    138
    139
    140
    141
    142
    143
    144
    145
    146
    147
    148
    149
    150
    151
    152
    153
    154
    155
    156
    157
    158
    159
    160
    161
    162
    163
    164
    165
    166
    167
    168
    169
    170
    171
    172
    173
    174
    175
    176
    177
    178
    179
    180
          function showTrailheads() {
    
            const trailheadsLayerName = "Trailheads";
            const trailheadsLayerURL =
              "https://services3.arcgis.com/GVgbJbqm8hXASVYi/arcgis/rest/services/" +
              trailheadsLayerName +
              "/FeatureServer/0/query?where=1%3D1&outFields=*&returnGeometry=true&f=pgeojson";
            map.addSource("trailheads", {
              type: "geojson",
              data: trailheadsLayerURL
            });
    
            map.addLayer({
              id: "trailheads-symbol",
              type: "symbol",
              source: "trailheads",
              layout: {
                "icon-image": "hiker-icon",
                "icon-size": 0.3,
                "icon-allow-overlap": true,
    
              }
            });
    
          }
    
    Expand
  3. Add additional label properties. Set a text-anchor of bottom, with a text-offset of [0, -2] to position the label above the icon. Use the TRL_NAME attribute as the text field.

    Expand
    Use dark colors for code blocks
    1
    2
    3
    4
    5
    6
    7
    8
    9
    10
    11
    12
    13
    14
    15
    16
    17
    18
    19
    20
    21
    22
    23
    24
    25
    26
    27
    28
    29
    30
    31
    32
    33
    34
    35
    36
    37
    38
    39
    40
    41
    42
    43
    44
    45
    46
    47
    48
    49
    50
    51
    52
    53
    54
    55
    56
    57
    58
    59
    60
    61
    62
    63
    64
    65
    66
    67
    68
    69
    70
    71
    72
    73
    74
    75
    76
    77
    78
    79
    80
    81
    82
    83
    84
    85
    86
    87
    88
    89
    90
    91
    92
    93
    94
    95
    96
    97
    98
    99
    100
    101
    102
    103
    104
    105
    106
    107
    108
    109
    110
    111
    112
    113
    114
    115
    116
    117
    118
    119
    120
    121
    122
    123
    124
    125
    126
    127
    128
    129
    130
    131
    132
    133
    134
    135
    136
    137
    138
    139
    140
    141
    142
    143
    144
    145
    146
    147
    148
    149
    150
    151
    152
    153
    154
    155
    156
    157
    158
    159
    160
    161
    162
    163
    164
    165
    166
    167
    168
    169
    170
    171
    172
    173
    174
    175
    176
    177
    178
    179
    180
            map.addLayer({
              id: "trailheads-symbol",
              type: "symbol",
              source: "trailheads",
              layout: {
                "icon-image": "hiker-icon",
                "icon-size": 0.3,
                "icon-allow-overlap": true,
    
                "text-font": ["Arial Italic"],
                "text-field": ["get", "TRL_NAME"],
                "text-size": 12,
                "text-anchor": "bottom",
                "text-offset": [0, -2]
    
              },
              paint: {
                "text-color": "white",
                "text-halo-color": "seagreen",
                "text-halo-width": 2
    
              }
            });
    
    Expand

Add a load event handler

It is important to wait for the MapLibre GL JS map to finish loading before adding any layers.

  1. Add an event handler to the map load event. Inside, call the showTrailheads function.

    Expand
    Use dark colors for code blocks
    1
    2
    3
    4
    5
    6
    7
    8
    9
    10
    11
    12
    13
    14
    15
    16
    17
    18
    19
    20
    21
    22
    23
    24
    25
    26
    27
    28
    29
    30
    31
    32
    33
    34
    35
    36
    37
    38
    39
    40
    41
    42
    43
    44
    45
    46
    47
    48
    49
    50
    51
    52
    53
    54
    55
    56
    57
    58
    59
    60
    61
    62
    63
    64
    65
    66
    67
    68
    69
    70
    71
    72
    73
    74
    75
    76
    77
    78
    79
    80
    81
    82
    83
    84
    85
    86
    87
    88
    89
    90
    91
    92
    93
    94
    95
    96
    97
    98
    99
    100
    101
    102
    103
    104
    105
    106
    107
    108
    109
    110
    111
    112
    113
    114
    115
    116
    117
    118
    119
    120
    121
    122
    123
    124
    125
    126
    127
    128
    129
    130
    131
    132
    133
    134
    135
    136
    137
    138
    139
    140
    141
    142
    143
    144
    145
    146
    147
    148
    149
    150
    151
    152
    153
    154
    155
    156
    157
    158
    159
    160
    161
    162
    163
    164
    165
    166
    167
    168
    169
    170
    171
    172
    173
    174
    175
    176
    177
    178
    179
    180
              },
              paint: {
                "text-color": "white",
                "text-halo-color": "seagreen",
                "text-halo-width": 2
    
              }
            });
    
          }
    
          map.on("load", () => {
    
            showTrailheads();
    
          });
    
    Expand
  2. At the top right, click Run to test your map. You should see icons and labels at each of the trailheads.

Style and display all trails

  1. Create a showTrails function. Inside, add a GeoJSON source with id trails.

    Expand
    Use dark colors for code blocks
    1
    2
    3
    4
    5
    6
    7
    8
    9
    10
    11
    12
    13
    14
    15
    16
    17
    18
    19
    20
    21
    22
    23
    24
    25
    26
    27
    28
    29
    30
    31
    32
    33
    34
    35
    36
    37
    38
    39
    40
    41
    42
    43
    44
    45
    46
    47
    48
    49
    50
    51
    52
    53
    54
    55
    56
    57
    58
    59
    60
    61
    62
    63
    64
    65
    66
    67
    68
    69
    70
    71
    72
    73
    74
    75
    76
    77
    78
    79
    80
    81
    82
    83
    84
    85
    86
    87
    88
    89
    90
    91
    92
    93
    94
    95
    96
    97
    98
    99
    100
    101
    102
    103
    104
    105
    106
    107
    108
    109
    110
    111
    112
    113
    114
    115
    116
    117
    118
    119
    120
    121
    122
    123
    124
    125
    126
    127
    128
    129
    130
    131
    132
    133
    134
    135
    136
    137
    138
    139
    140
    141
    142
    143
    144
    145
    146
    147
    148
    149
    150
    151
    152
    153
    154
    155
    156
    157
    158
    159
    160
    161
    162
    163
    164
    165
    166
    167
    168
    169
    170
    171
    172
    173
    174
    175
    176
    177
    178
    179
    180
              },
              paint: {
                "text-color": "white",
                "text-halo-color": "seagreen",
                "text-halo-width": 2
    
              }
            });
    
          }
    
          function showTrails() {
    
            const trailsLayerName = "Trails";
            const trailsLayerURL =
              "https://services3.arcgis.com/GVgbJbqm8hXASVYi/arcgis/rest/services/" +
              trailsLayerName +
              "/FeatureServer/0/query?where=1%3D1&outFields=*&returnGeometry=true&f=pgeojson";
            map.addSource("trails", {
              type: "geojson",
              data: trailsLayerURL
            });
    
          }
    
    Expand
  2. Add a line layer with id trails-line to display the trails source.

    Expand
    Use dark colors for code blocks
    1
    2
    3
    4
    5
    6
    7
    8
    9
    10
    11
    12
    13
    14
    15
    16
    17
    18
    19
    20
    21
    22
    23
    24
    25
    26
    27
    28
    29
    30
    31
    32
    33
    34
    35
    36
    37
    38
    39
    40
    41
    42
    43
    44
    45
    46
    47
    48
    49
    50
    51
    52
    53
    54
    55
    56
    57
    58
    59
    60
    61
    62
    63
    64
    65
    66
    67
    68
    69
    70
    71
    72
    73
    74
    75
    76
    77
    78
    79
    80
    81
    82
    83
    84
    85
    86
    87
    88
    89
    90
    91
    92
    93
    94
    95
    96
    97
    98
    99
    100
    101
    102
    103
    104
    105
    106
    107
    108
    109
    110
    111
    112
    113
    114
    115
    116
    117
    118
    119
    120
    121
    122
    123
    124
    125
    126
    127
    128
    129
    130
    131
    132
    133
    134
    135
    136
    137
    138
    139
    140
    141
    142
    143
    144
    145
    146
    147
    148
    149
    150
    151
    152
    153
    154
    155
    156
    157
    158
    159
    160
    161
    162
    163
    164
    165
    166
    167
    168
    169
    170
    171
    172
    173
    174
    175
    176
    177
    178
    179
    180
          function showTrails() {
    
            const trailsLayerName = "Trails";
            const trailsLayerURL =
              "https://services3.arcgis.com/GVgbJbqm8hXASVYi/arcgis/rest/services/" +
              trailsLayerName +
              "/FeatureServer/0/query?where=1%3D1&outFields=*&returnGeometry=true&f=pgeojson";
            map.addSource("trails", {
              type: "geojson",
              data: trailsLayerURL
            });
    
            map.addLayer({
              id: "trails-line",
              type: "line",
              source: "trails",
              paint: {
                "line-color": "hsl(291, 44%, 60%)",
    
                "line-opacity": 0.75
              }
            });
    
          }
    
    Expand
  3. At the top right, click Run to test your map. The trails should display as purple lines.

Style trail width by elevation gain

To make the width of the trail line reflect the elevation gain, you can use a MapLibre GL expression as the value of the line-width. You use the ['interpolate'] and ['get'] expressions to achieve this.

  1. Update the trails-line layer definition that calculates line-width from the ELEV_GAIN attribute.

    Expand
    Use dark colors for code blocks
    1
    2
    3
    4
    5
    6
    7
    8
    9
    10
    11
    12
    13
    14
    15
    16
    17
    18
    19
    20
    21
    22
    23
    24
    25
    26
    27
    28
    29
    30
    31
    32
    33
    34
    35
    36
    37
    38
    39
    40
    41
    42
    43
    44
    45
    46
    47
    48
    49
    50
    51
    52
    53
    54
    55
    56
    57
    58
    59
    60
    61
    62
    63
    64
    65
    66
    67
    68
    69
    70
    71
    72
    73
    74
    75
    76
    77
    78
    79
    80
    81
    82
    83
    84
    85
    86
    87
    88
    89
    90
    91
    92
    93
    94
    95
    96
    97
    98
    99
    100
    101
    102
    103
    104
    105
    106
    107
    108
    109
    110
    111
    112
    113
    114
    115
    116
    117
    118
    119
    120
    121
    122
    123
    124
    125
    126
    127
    128
    129
    130
    131
    132
    133
    134
    135
    136
    137
    138
    139
    140
    141
    142
    143
    144
    145
    146
    147
    148
    149
    150
    151
    152
    153
    154
    155
    156
    157
    158
    159
    160
    161
    162
    163
    164
    165
    166
    167
    168
    169
    170
    171
    172
    173
    174
    175
    176
    177
    178
    179
    180
            map.addLayer({
              id: "trails-line",
              type: "line",
              source: "trails",
              paint: {
                "line-color": "hsl(291, 44%, 60%)",
    
                "line-width": ["interpolate", ["linear"], ["get", "ELEV_GAIN"], 0, 3, 2300, 7],
    
                "line-opacity": 0.75
              }
            });
    
    Expand
  2. At the top right, click Run to test your map. The trails should display as purple lines with varying thickness based on elevation gain.

Display bike-only trails

You can limit a layer to display only certain features by setting a filter. A filter is defined by an expression that should evaluate to true for the features you want included.

To show trails that allow bikes with a dashed line, you can create a new layer that sits above the other trails layer. You can reuse the existing source.

  1. Create a function called showBikeTrails. Inside, add a layer with id biketrails-line. Use a filter to only show trails where USE_BIKE has a value of YES. Set line-dasharray to [1, 2] to create short dashes.

    Expand
    Use dark colors for code blocks
    1
    2
    3
    4
    5
    6
    7
    8
    9
    10
    11
    12
    13
    14
    15
    16
    17
    18
    19
    20
    21
    22
    23
    24
    25
    26
    27
    28
    29
    30
    31
    32
    33
    34
    35
    36
    37
    38
    39
    40
    41
    42
    43
    44
    45
    46
    47
    48
    49
    50
    51
    52
    53
    54
    55
    56
    57
    58
    59
    60
    61
    62
    63
    64
    65
    66
    67
    68
    69
    70
    71
    72
    73
    74
    75
    76
    77
    78
    79
    80
    81
    82
    83
    84
    85
    86
    87
    88
    89
    90
    91
    92
    93
    94
    95
    96
    97
    98
    99
    100
    101
    102
    103
    104
    105
    106
    107
    108
    109
    110
    111
    112
    113
    114
    115
    116
    117
    118
    119
    120
    121
    122
    123
    124
    125
    126
    127
    128
    129
    130
    131
    132
    133
    134
    135
    136
    137
    138
    139
    140
    141
    142
    143
    144
    145
    146
    147
    148
    149
    150
    151
    152
    153
    154
    155
    156
    157
    158
    159
    160
    161
    162
    163
    164
    165
    166
    167
    168
    169
    170
    171
    172
    173
    174
    175
    176
    177
    178
    179
    180
            map.addLayer({
              id: "trails-line",
              type: "line",
              source: "trails",
              paint: {
                "line-color": "hsl(291, 44%, 60%)",
    
                "line-width": ["interpolate", ["linear"], ["get", "ELEV_GAIN"], 0, 3, 2300, 7],
    
                "line-opacity": 0.75
              }
            });
    
          }
    
          function showBikeTrails() {
    
            map.addLayer({
              id: "biketrails-line",
              type: "line",
              source: "trails",
              filter: ["==", ["get", "USE_BIKE"], "Yes"],
              paint: {
                "line-dasharray": [1, 2],
                "line-width": 2,
                "line-color": "hsl(300, 100%, 78.4%)"
              }
            });
    
          }
    
    Expand
  2. In the load event handler, call the showTrails and showBikeTrails functions. Add the calls before showTrailheads so that the trails layers are placed beneath the trailheads.

    Expand
    Use dark colors for code blocks
    1
    2
    3
    4
    5
    6
    7
    8
    9
    10
    11
    12
    13
    14
    15
    16
    17
    18
    19
    20
    21
    22
    23
    24
    25
    26
    27
    28
    29
    30
    31
    32
    33
    34
    35
    36
    37
    38
    39
    40
    41
    42
    43
    44
    45
    46
    47
    48
    49
    50
    51
    52
    53
    54
    55
    56
    57
    58
    59
    60
    61
    62
    63
    64
    65
    66
    67
    68
    69
    70
    71
    72
    73
    74
    75
    76
    77
    78
    79
    80
    81
    82
    83
    84
    85
    86
    87
    88
    89
    90
    91
    92
    93
    94
    95
    96
    97
    98
    99
    100
    101
    102
    103
    104
    105
    106
    107
    108
    109
    110
    111
    112
    113
    114
    115
    116
    117
    118
    119
    120
    121
    122
    123
    124
    125
    126
    127
    128
    129
    130
    131
    132
    133
    134
    135
    136
    137
    138
    139
    140
    141
    142
    143
    144
    145
    146
    147
    148
    149
    150
    151
    152
    153
    154
    155
    156
    157
    158
    159
    160
    161
    162
    163
    164
    165
    166
    167
    168
    169
    170
    171
    172
    173
    174
    175
    176
    177
    178
    179
    180
          map.on("load", () => {
    
            showTrails();
            showBikeTrails();
    
            showTrailheads();
    
          });
    
    Expand
  3. At the top right, click Run to test your map. The trails should appear as dashed lines for trails that allow bikes.

Display park areas with different colors

You can use a different style for each unique attribute value in a feature layer. Use a ['match', ...] expression to display park polygons with different colors depending on the TYPE field.

  1. Create a function called showParks. Inside, add a GeoJSON source for the parks. Give it an id of parks.

    Expand
    Use dark colors for code blocks
    1
    2
    3
    4
    5
    6
    7
    8
    9
    10
    11
    12
    13
    14
    15
    16
    17
    18
    19
    20
    21
    22
    23
    24
    25
    26
    27
    28
    29
    30
    31
    32
    33
    34
    35
    36
    37
    38
    39
    40
    41
    42
    43
    44
    45
    46
    47
    48
    49
    50
    51
    52
    53
    54
    55
    56
    57
    58
    59
    60
    61
    62
    63
    64
    65
    66
    67
    68
    69
    70
    71
    72
    73
    74
    75
    76
    77
    78
    79
    80
    81
    82
    83
    84
    85
    86
    87
    88
    89
    90
    91
    92
    93
    94
    95
    96
    97
    98
    99
    100
    101
    102
    103
    104
    105
    106
    107
    108
    109
    110
    111
    112
    113
    114
    115
    116
    117
    118
    119
    120
    121
    122
    123
    124
    125
    126
    127
    128
    129
    130
    131
    132
    133
    134
    135
    136
    137
    138
    139
    140
    141
    142
    143
    144
    145
    146
    147
    148
    149
    150
    151
    152
    153
    154
    155
    156
    157
    158
    159
    160
    161
    162
    163
    164
    165
    166
    167
    168
    169
    170
    171
    172
    173
    174
    175
    176
    177
    178
    179
    180
            map.addLayer({
              id: "biketrails-line",
              type: "line",
              source: "trails",
              filter: ["==", ["get", "USE_BIKE"], "Yes"],
              paint: {
                "line-dasharray": [1, 2],
                "line-width": 2,
                "line-color": "hsl(300, 100%, 78.4%)"
              }
            });
    
          }
    
          function showParks() {
    
            const parksLayerName = "Parks_and_Open_Space";
            const parksLayerURL =
              "https://services3.arcgis.com/GVgbJbqm8hXASVYi/arcgis/rest/services/" +
              parksLayerName +
              "/FeatureServer/0/query?where=1%3D1&outFields=*&returnGeometry=true&f=pgeojson";
            map.addSource("parks", {
              type: "geojson",
              data: parksLayerURL
            });
    
          }
    
    Expand
  2. Add a fill layer with id parks-fill and source parks. For the fill color, use a match expression for different TYPE values.

    Expand
    Use dark colors for code blocks
    1
    2
    3
    4
    5
    6
    7
    8
    9
    10
    11
    12
    13
    14
    15
    16
    17
    18
    19
    20
    21
    22
    23
    24
    25
    26
    27
    28
    29
    30
    31
    32
    33
    34
    35
    36
    37
    38
    39
    40
    41
    42
    43
    44
    45
    46
    47
    48
    49
    50
    51
    52
    53
    54
    55
    56
    57
    58
    59
    60
    61
    62
    63
    64
    65
    66
    67
    68
    69
    70
    71
    72
    73
    74
    75
    76
    77
    78
    79
    80
    81
    82
    83
    84
    85
    86
    87
    88
    89
    90
    91
    92
    93
    94
    95
    96
    97
    98
    99
    100
    101
    102
    103
    104
    105
    106
    107
    108
    109
    110
    111
    112
    113
    114
    115
    116
    117
    118
    119
    120
    121
    122
    123
    124
    125
    126
    127
    128
    129
    130
    131
    132
    133
    134
    135
    136
    137
    138
    139
    140
    141
    142
    143
    144
    145
    146
    147
    148
    149
    150
    151
    152
    153
    154
    155
    156
    157
    158
    159
    160
    161
    162
    163
    164
    165
    166
    167
    168
    169
    170
    171
    172
    173
    174
    175
    176
    177
    178
    179
    180
          function showParks() {
    
            const parksLayerName = "Parks_and_Open_Space";
            const parksLayerURL =
              "https://services3.arcgis.com/GVgbJbqm8hXASVYi/arcgis/rest/services/" +
              parksLayerName +
              "/FeatureServer/0/query?where=1%3D1&outFields=*&returnGeometry=true&f=pgeojson";
            map.addSource("parks", {
              type: "geojson",
              data: parksLayerURL
            });
    
            map.addLayer({
              id: "parks-fill",
              type: "fill",
              source: "parks",
              paint: {
                "fill-color": [
                  "match",
                  ["get", "TYPE"],
                  "Natural Areas",
                  "#9E559C",
                  "Regional Open Space",
                  "#A7C636",
                  "Local Park",
                  "#149ECE",
                  "Regional Recreation Park",
                  "#ED5151",
                  "black"
                ],
                "fill-opacity": 0.2
              }
            });
    
          }
    
    Expand
  3. Back inside the load event handler, call the showParks functions. Place it before the other functions so that the parks layer is placed under the trails and trailheads.

    Expand
    Use dark colors for code blocks
    1
    2
    3
    4
    5
    6
    7
    8
    9
    10
    11
    12
    13
    14
    15
    16
    17
    18
    19
    20
    21
    22
    23
    24
    25
    26
    27
    28
    29
    30
    31
    32
    33
    34
    35
    36
    37
    38
    39
    40
    41
    42
    43
    44
    45
    46
    47
    48
    49
    50
    51
    52
    53
    54
    55
    56
    57
    58
    59
    60
    61
    62
    63
    64
    65
    66
    67
    68
    69
    70
    71
    72
    73
    74
    75
    76
    77
    78
    79
    80
    81
    82
    83
    84
    85
    86
    87
    88
    89
    90
    91
    92
    93
    94
    95
    96
    97
    98
    99
    100
    101
    102
    103
    104
    105
    106
    107
    108
    109
    110
    111
    112
    113
    114
    115
    116
    117
    118
    119
    120
    121
    122
    123
    124
    125
    126
    127
    128
    129
    130
    131
    132
    133
    134
    135
    136
    137
    138
    139
    140
    141
    142
    143
    144
    145
    146
    147
    148
    149
    150
    151
    152
    153
    154
    155
    156
    157
    158
    159
    160
    161
    162
    163
    164
    165
    166
    167
    168
    169
    170
    171
    172
    173
    174
    175
    176
    177
    178
    179
    180
          map.on("load", () => {
    
            showParks();
    
            showTrails();
            showBikeTrails();
    
            showTrailheads();
    
          });
    
    Expand

Run the app

In CodePen, run your code to display the map.

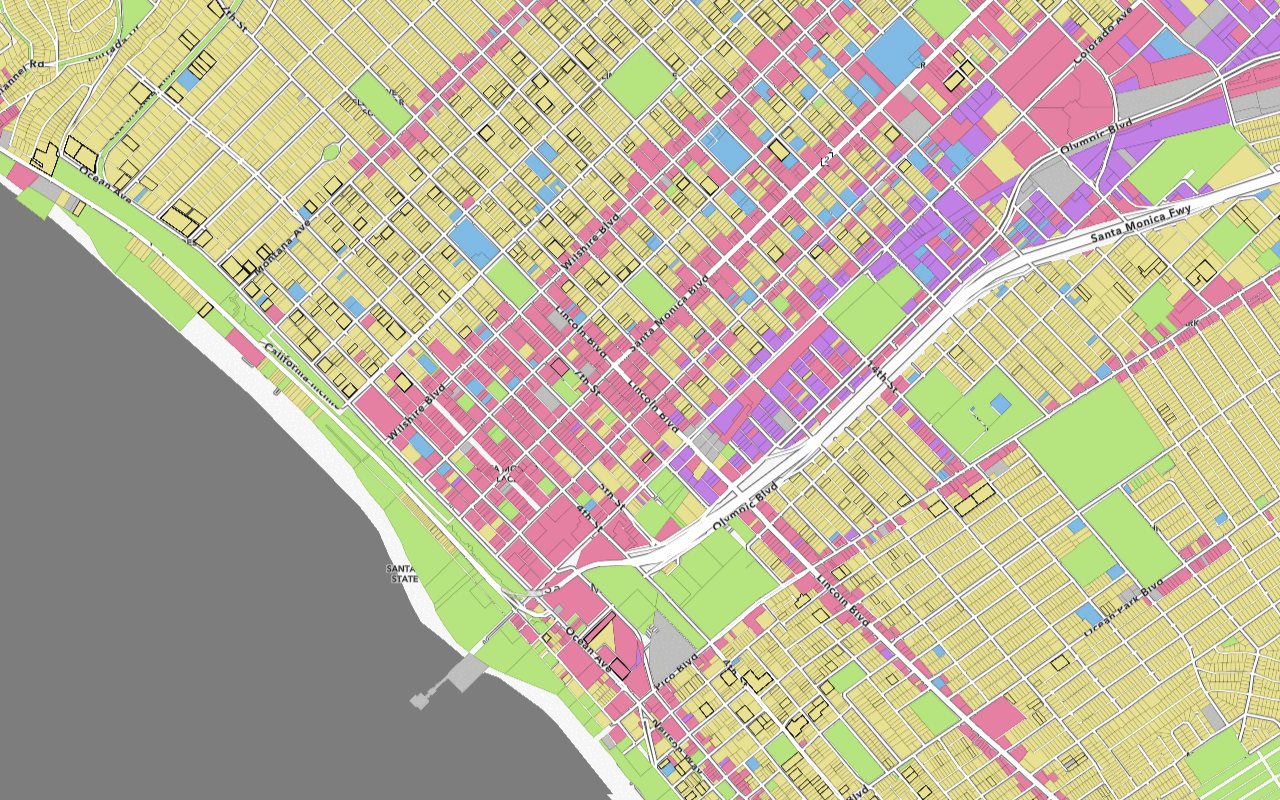
You should now see trailheads with icons and labels, trails whose width varies by elevation, dashed lines for trails that allow bikes, and parks of different colors.

What's next?

Learn how to use additional ArcGIS location services in these tutorials:
Your browser is no longer supported. Please upgrade your browser for the best experience. See our browser deprecation post for more details.