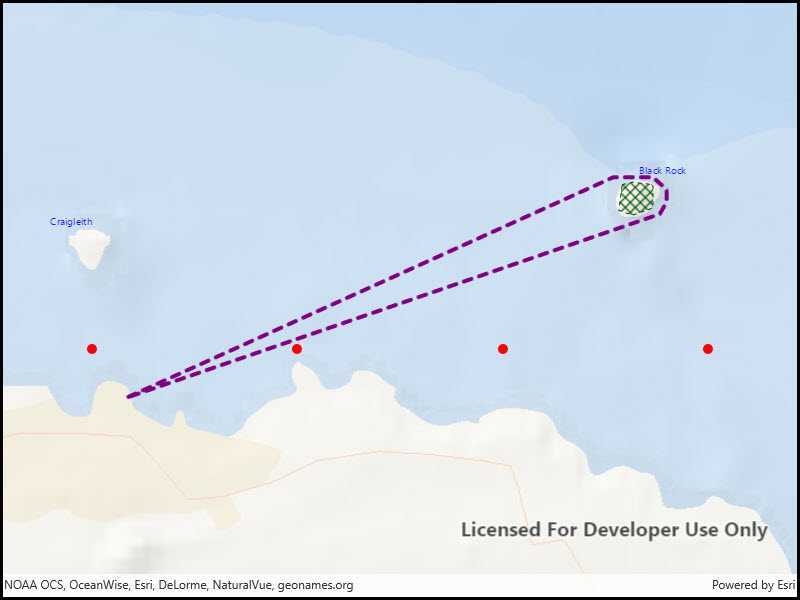
Use a symbol style to display a graphic on a graphics overlay.

Use case
Allows you to customize a graphic by assigning a unique symbol. For example, you may wish to display individual graphics for different landmarks across a region, and to style each one with a unique symbol.
How to use the sample
Observe the graphics on the map.
How it works
- Create a
GraphicsOverlayand add it to theMapView. - Create a
Symbolsuch asSimpleMarkerSymbol,SimpleLineSymbolorSimpleFillSymbol. - Create a
Graphic, specifying aGeometryand aSymbol. - Add the
Graphicto theGraphicsOverlay.
Relevant API
- Geometry
- Graphic
- GraphicsOverlay
- SimpleFillSymbol
- SimpleLineSymbol
- SimpleMarkerSymbol
Additional information
To set a symbol style across a number of graphics (e.g. showing trees as graphics sharing a symbol in a park), see the "Add graphics with renderer" sample.
Tags
SimpleFillSymbol, SimpleLineSymbol, SimpleMarkerSymbol
Sample Code
<UserControl
x:Class="ArcGISRuntime.UWP.Samples.AddGraphicsWithSymbols.AddGraphicsWithSymbols"
xmlns="http://schemas.microsoft.com/winfx/2006/xaml/presentation"
xmlns:x="http://schemas.microsoft.com/winfx/2006/xaml"
xmlns:mc="http://schemas.openxmlformats.org/markup-compatibility/2006"
xmlns:d="http://schemas.microsoft.com/expression/blend/2008"
xmlns:esri="using:Esri.ArcGISRuntime"
xmlns:esriUI="using:Esri.ArcGISRuntime.UI.Controls"
mc:Ignorable="d"
d:DesignHeight="300" d:DesignWidth="300">
<Grid>
<esriUI:MapView x:Name="MyMapView" />
</Grid>
</UserControl>