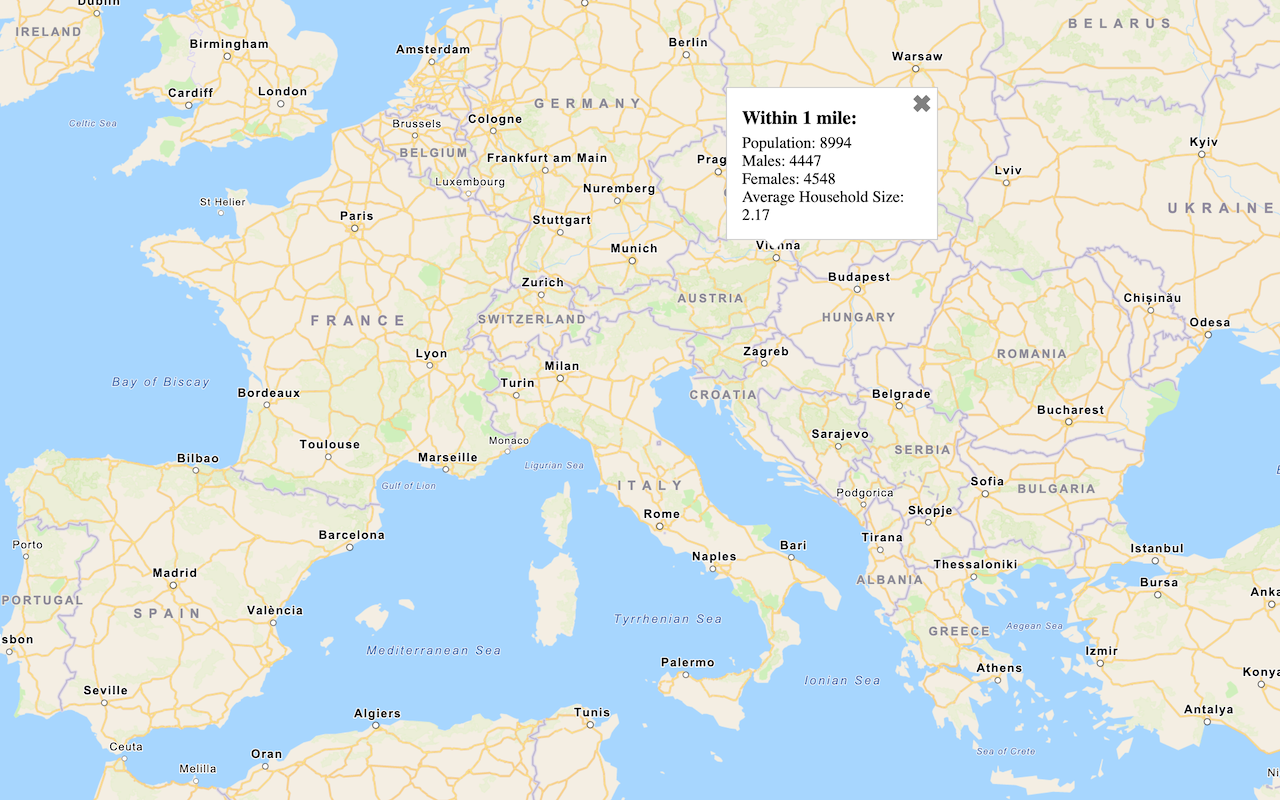
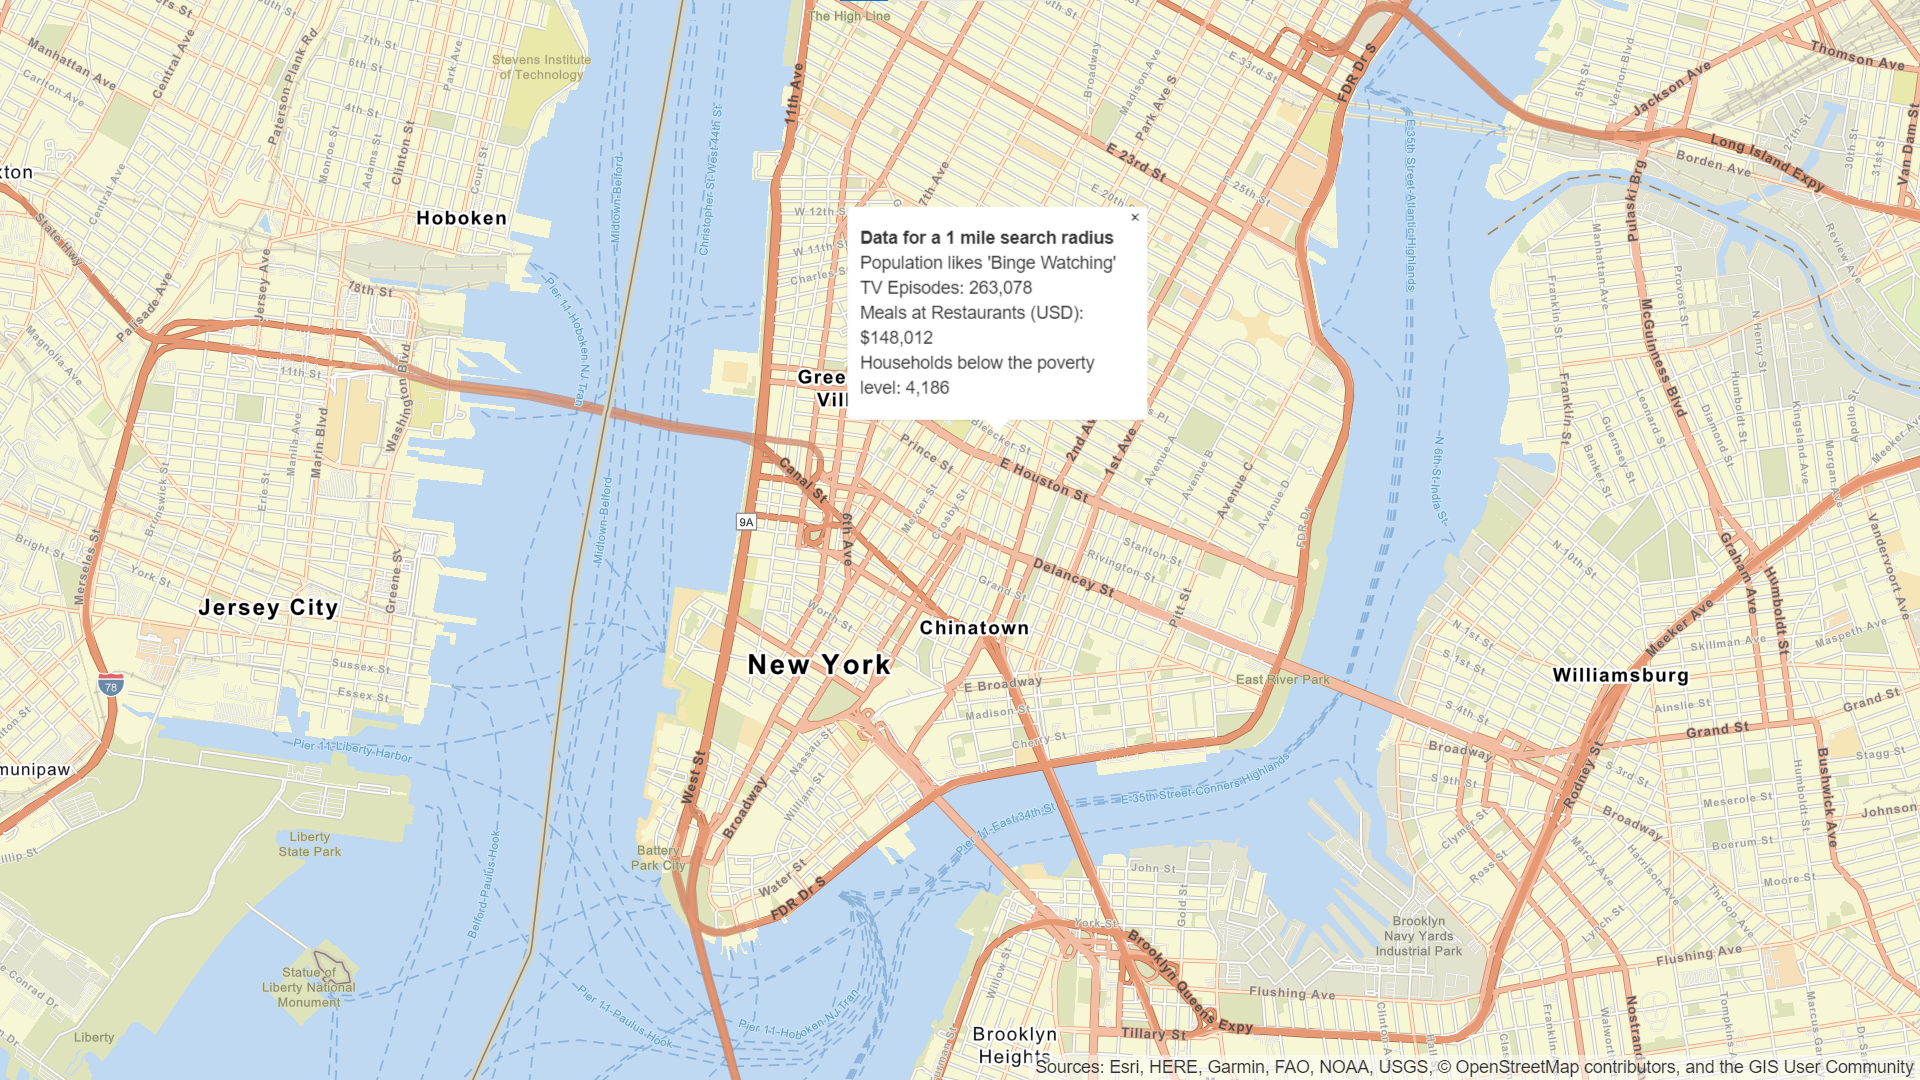
To find local or global data for an area, you use the GeoEnrichment service. GeoEnrichment is the process of enhancing (enriching) existing data with additional location-based information about the people and places in a specific area. The enriched data can drive better understanding, analysis, and decision making.
You can build applications that use the service to:
- Find demographics and other relevant characteristics within an area around a point.
- Choose from over 15,000 analysis variables in more than 130 countries and regions including demographics, lifestyle segmentation, consumer spending, and market potential.
- Enrich your own data with location based context about the people and places in an area.
- Analyze markets and consumers, identify underserved communities, and formulate better business and policy decisions.
How to access the GeoEnrichment service
There is no direct integration with OpenLayers to access the GeoEnrichment service. To access the service in your application, you use the demographics and request modules from ArcGIS REST JS.
To access the service with ArcGIS REST JS, you typically perform the following steps:
- Reference the appropriate package.
- Set the API key to authenticate the request.
- Define parameters to pass to the service.
- Call the service and handle the results.
Example
Find demographic data
This example illustrates how to query demographic data from the GeoEnrichment service using ArcGIS REST JS. The default study area is a one mile buffer around a point. It returns facts from the default data collection, Key global facts.
<script src="https://unpkg.com/@esri/arcgis-rest-request@4.0.0/dist/bundled/request.umd.js"></script>
<script
src="https://unpkg.com/@esri/arcgis-rest-demographics@4.0.0/dist/bundled/demographics.umd.js"></script>
</head>
<body>
<div id="map"></div>
<script>
const authentication = arcgisRest.ApiKeyManager.fromKey(accessToken);
arcgisRest
.queryDemographicData({
studyAreas: [{ geometry: { x: lonLat[0], y: lonLat[1] } }],
dataCollections: ["KeyGlobalFacts"],
authentication: authentication
})
.then((response) => {
const featureSet = response.results[0].value.FeatureSet;
let message;
if (featureSet.length > 0 && featureSet[0].features.length > 0) {
const attributes = featureSet[0].features[0].attributes;
message =
`<b>Data for a 1 mile search radius</b>` +
[
`<br>Population: ${attributes.TOTPOP}`,
`Males: ${attributes.TOTMALES} `,
`Females: ${attributes.TOTFEMALES}`,
`Average Household Size: ${attributes.AVGHHSZ}`
].join("<br>");
} else {
message = "Data not available for this location.";
}
popup.show(event.coordinate, message);
});
</script>

