Learn how to use OpenLayers to display a map.
A map contains layers of geographic data. A map contains a basemap layer and, optionally, one or more data layers. You can display a specific area of a map by using a map view and setting the location and zoom level.
In this tutorial you will use OpenLayers to display a map of the Santa Monica Mountains in California using the Outdoor basemap layer.
This tutorial is the starting point for the other OpenLayers tutorials.
Prerequisites
An ArcGIS Location Platform or ArcGIS Online account.
Steps
Create a new app
Select a type of authentication below and follow the steps to create a new application.
Set up authentication
Create developer credentials in your portal for the type of authentication you selected.
Set developer credentials
Use the API key or OAuth developer credentials created in the previous step in your application.
Add script references
You will need add <script and <link tags to load the JavaScript and CSS files for OpenLayers and ol-mapbox-style.
-
In the index.html file, add the following
<linkand> <scriptreferences if they are missing.> Use dark colors for code blocks <style> html, body, #map { padding: 0; margin: 0; height: 100%; width: 100%; font-family: Arial, Helvetica, sans-serif; font-size: 14px; color: #323232; } </style> <link rel="stylesheet" href="https://cdn.jsdelivr.net/npm/ol@v10.4.0/ol.css" type="text/css" /> <script src="https://cdn.jsdelivr.net/npm/ol@v10.4.0/dist/ol.js"></script> <script src="https://cdn.jsdelivr.net/npm/ol-mapbox-style@12.3.5/dist/olms.js"></script>
Create a map and view
Use the Map and View classes to create an OpenLayers map.
The OpenLayers Map class displays the contents of the map and provides a user interface to interact with it. It supports clicking, zooming, panning, rotating, and tilting the perspective of the map. It also lets you interact with the visible contents of the map data, for example finding features at the mouse cursor. You can also use it to modify the data displayed by adding new sources or changing layer properties. OpenLayers takes care of automatically re-rendering as needed in response to changes made to layers.
For further details, see the OpenLayers documentation.
-
Use the
Mapclass to create the map with options to control its display and behavior. Set thetargetproperty to"map", which is the id of the div element.Use dark colors for code blocks const map = new ol.Map({ target: "map" }); -
Create a
View, and usesetto apply it to the map. To center the map view, set theView centerproperty to-118.80500,34.02700and thezoomproperty to13.Use dark colors for code blocks map.setView( new ol.View({ center: ol.proj.fromLonLat([-118.805, 34.027]), zoom: 12 }) );
Add the basemap layer
OpenLayers does not directly support a vector basemap or a vector style file, so you will use the openlayers-mapbox-style (olms) JavaScript library to load a Mapbox style from the Basemap styles service and render it with OpenLayers.
The Mapbox style is JSON file that contains a reference to the vector tile layers used in the style, and visual styling rules to apply to one or more data layers in those tiles.
-
Create a
basemapvariable and set it toId arcgis/outdoor.Use dark colors for code blocks const basemapId = "arcgis/outdoor"; -
Construct the basemap URL based on
basemapand your API key.Id Use dark colors for code blocks const basemapId = "arcgis/outdoor"; const basemapURL = `https://basemapstyles-api.arcgis.com/arcgis/rest/services/styles/v2/styles/${basemapId}?token=${accessToken}`; -
Use
olmsto apply the basemap style to your map. Theolmsfunction takes two inputs, themapelement and the URL for a basemap layer.Use dark colors for code blocks const basemapId = "arcgis/outdoor"; const basemapURL = `https://basemapstyles-api.arcgis.com/arcgis/rest/services/styles/v2/styles/${basemapId}?token=${accessToken}`; olms.apply(map, basemapURL) });
Add attribution
You need to display Esri and data attribution in all applications that use Esri technology. OpenLayers displays data attribution automatically for the basemap styles service, however, you need to take additional steps to display Esri attribution ("Powered by Esri").
-
Add a load event handler to the
olmsfunction call. Inside, Useseton the basemap source to add Powered by Esri to the map's attribution.Attributions Use dark colors for code blocks const basemapId = "arcgis/outdoor"; const basemapURL = `https://basemapstyles-api.arcgis.com/arcgis/rest/services/styles/v2/styles/${basemapId}?token=${accessToken}`; olms.apply(map, basemapURL) .then(() => { // Add Esri attribution // Learn more in https://esriurl.com/attribution const source = map.getLayers().item(0).getSource(); source.setAttributions("Powered by <a href='https://www.esri.com/en-us/home' target='_blank'>Esri</a> | ") });
Run the app
Run the app.
The map should display the streets basemap layer for an area of the Santa Monica Mountains in California. Pan and zoom to explore the map.What's next?
Learn how to use additional ArcGIS location services in these tutorials:
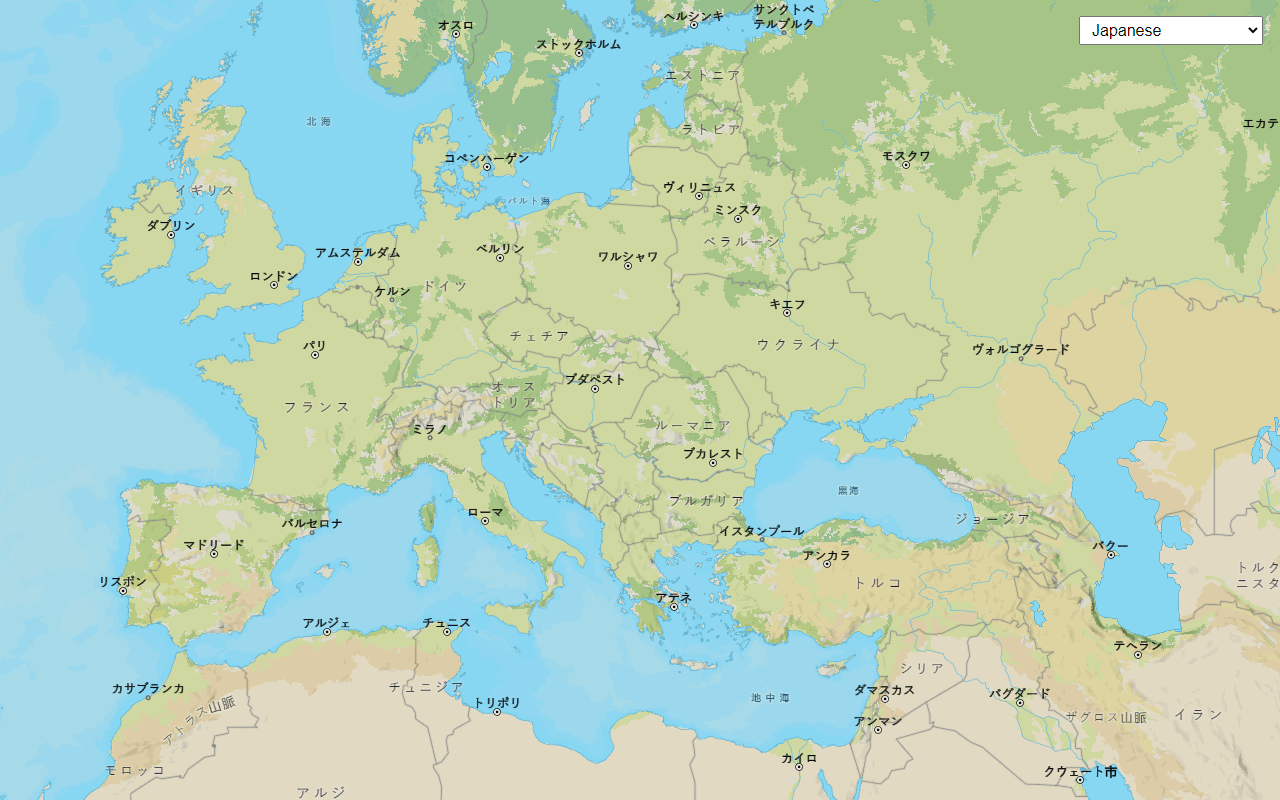
Change language labels for basemap styles
Switch the language of place labels on a basemap.
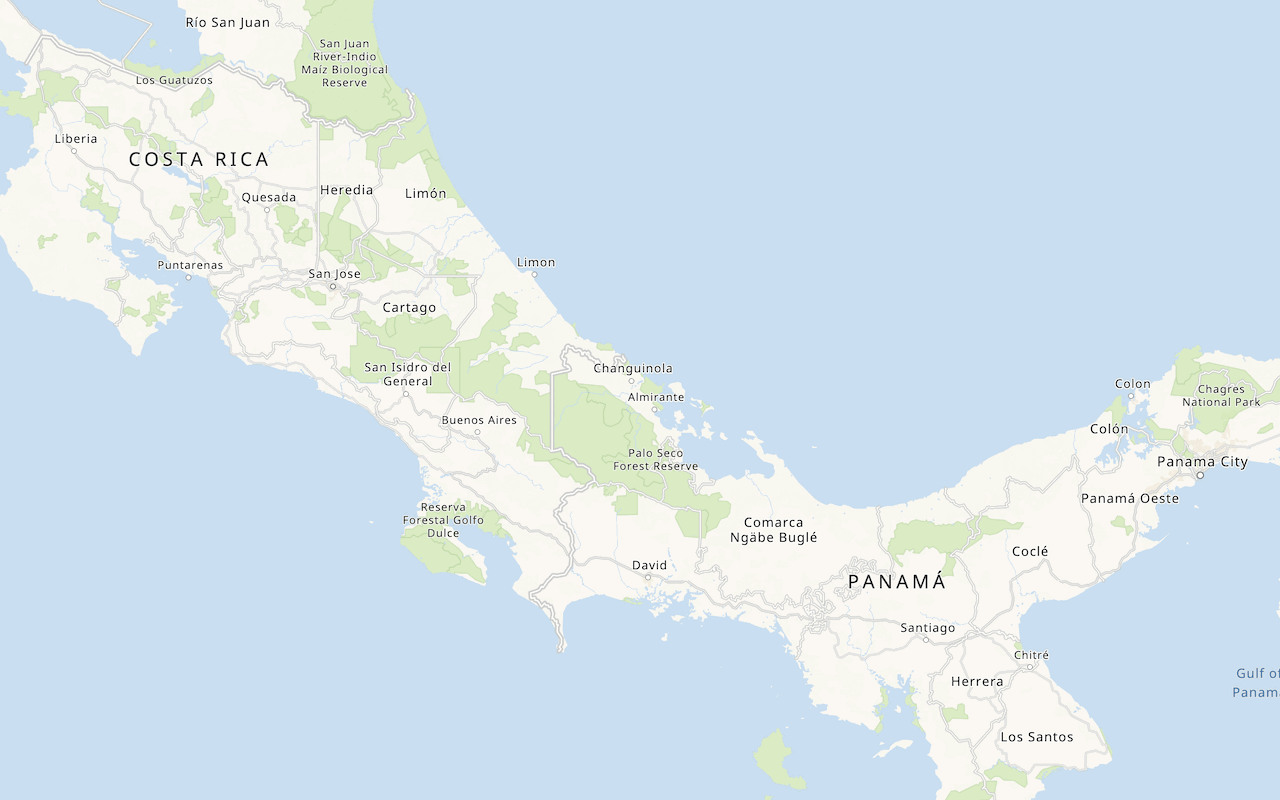
Display a custom basemap style
Add a styled vector basemap layer to a map.
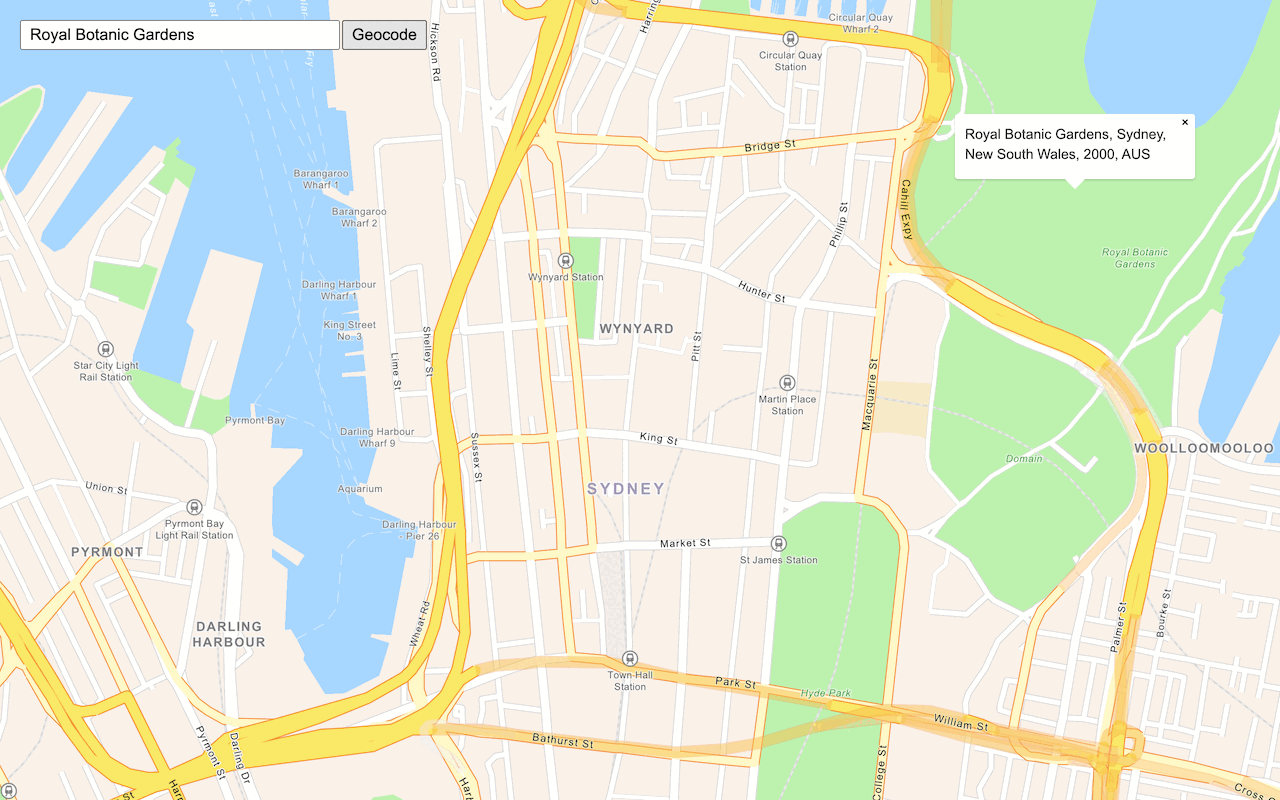
Search for an address
Find an address or place using a search box and the geocoding service.
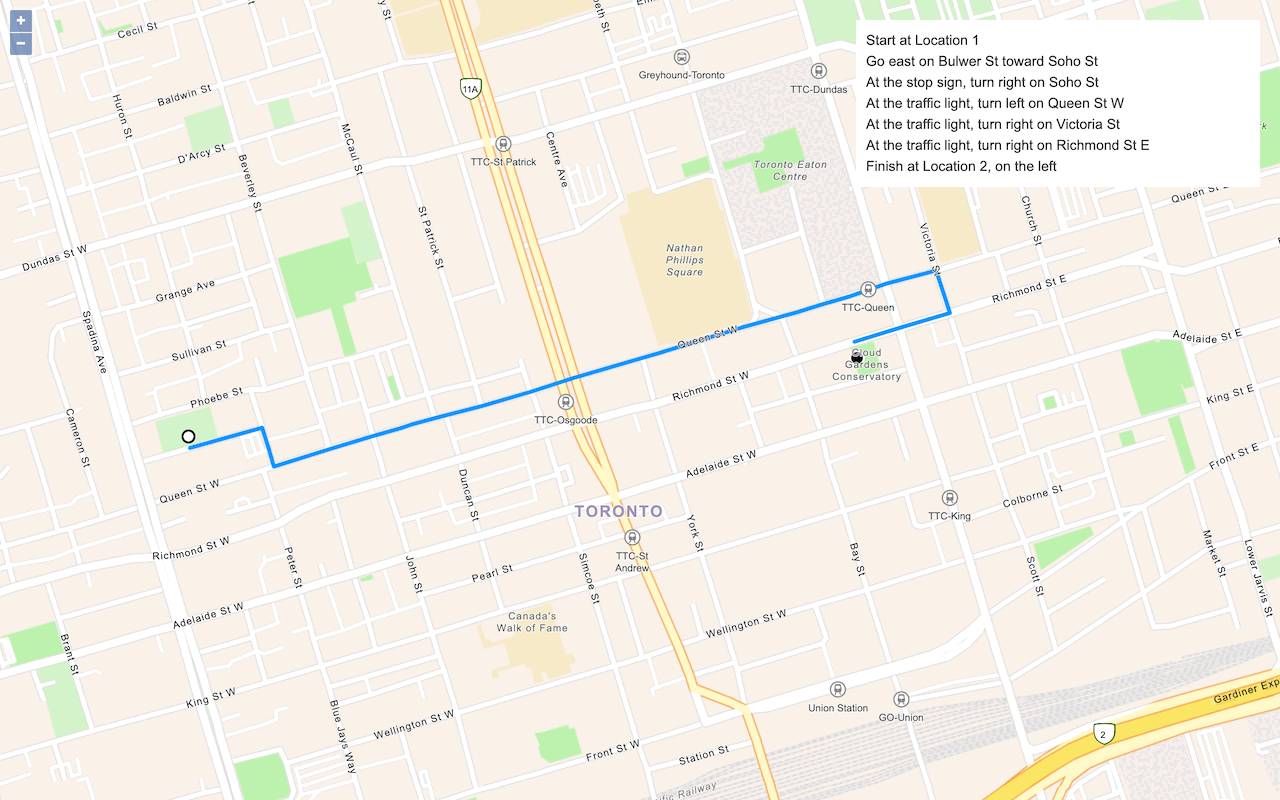
Find a route and directions
Find a route and directions with the route service.