Query a feature layer (spatial)

Learn how to execute a spatial query to access polygon features from a feature service.

A feature layer can contain a large number of features stored in ArcGIS. To access a subset of these features, you can execute an SQL or spatial query, either together or individually. The results can contain the attributes, geometry, or both for each record. SQL and spatial queries are useful when a feature layer is very large and you want to access only a subset of its data.

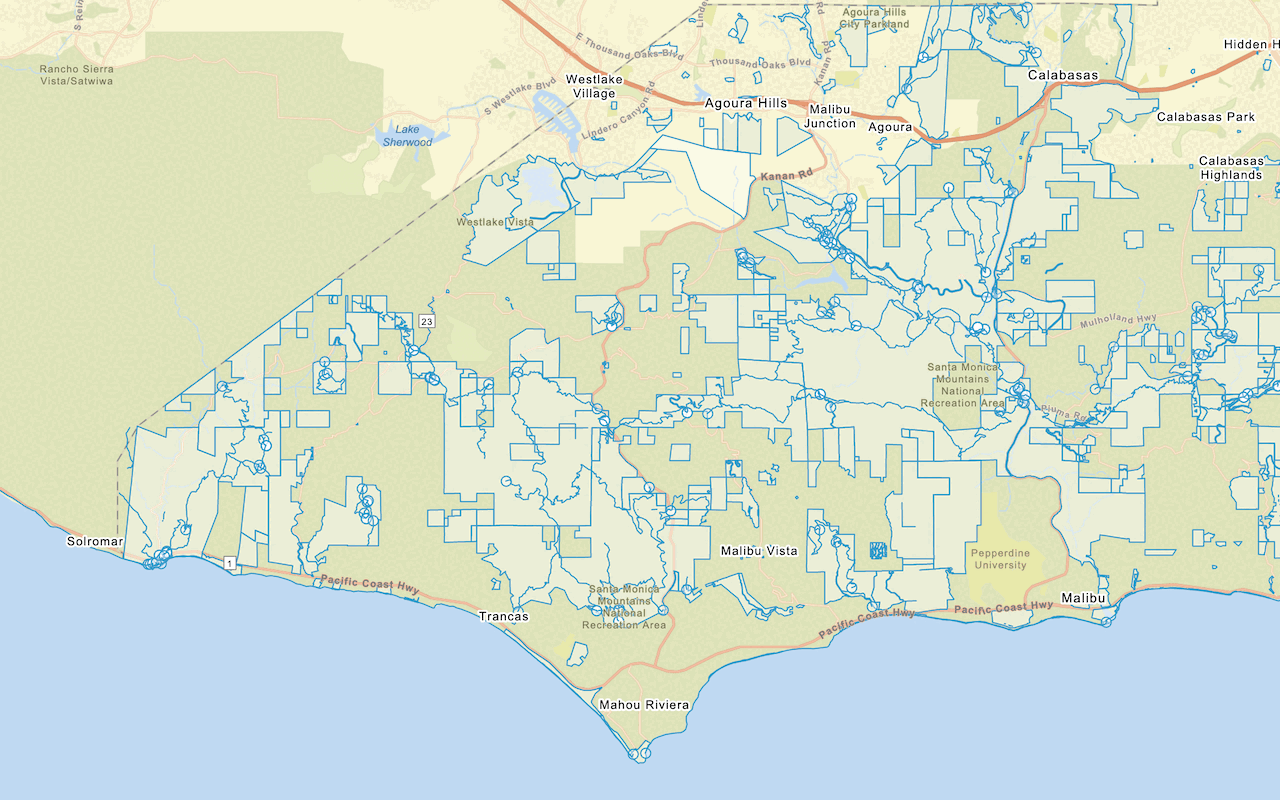
In this tutorial, you use the OpenLayers Draw interaction to sketch a feature on the map and ArcGIS REST JS to perform a spatial query against the LA County Parcels hosted feature layer. The layer contains ±2.4 million features. The spatial query returns all of the parcels that intersect the sketched feature. A pop-up is also used to display feature attributes.

Prerequisites

You need an ArcGIS Location Platform or ArcGIS Online account.

Steps

Create a new pen

  1. To get started, either complete the Display a map tutorial or .

Get an access token

You need an access token with the correct privileges to access the resources used in this tutorial.

  1. Go to the Create an API key tutorial and create an API key with the following privilege(s):

    • Privileges
      • Location services > Basemaps
    • Item access
      • Note: If you are using your own custom data layer for this tutorial, you need to grant the API key credentials access to the layer item. Learn more in Item access privileges.
  2. Copy the API key access token to your clipboard when prompted.

  3. In CodePen, update the accessToken variable to use your access token.

    Use dark colors for code blocks
    1
    2
    3
    4
    5
    6
    7
    8
    9
    10
    11
    const accessToken = "YOUR_ACCESS_TOKEN";
    const basemapId = "arcgis/streets";
    const basemapURL = `https://basemapstyles-api.arcgis.com/arcgis/rest/services/styles/v2/styles/${basemapId}?token=${accessToken}`;
    olms.apply(map, basemapURL);
    

To learn about the other types of authentication available, go to Types of authentication.

Add references

This tutorial uses ArcGIS REST JS to access a feature layer, and the ol-popup library to display pop-ups.

  1. In the <head> element, add references to the ArcGIS REST JS and ol-popup libraries.

    Expand
    Use dark colors for code blocks
    1
    2
    3
    4
    5
    6
    7
    8
    9
    10
    11
    12
    13
    14
    15
    16
    17
    18
    19
    20
    21
    22
    23
    24
    25
    26
    27
    28
    29
    30
    31
    32
    33
    34
    35
    36
    37
    38
    39
    40
    41
    42
    43
    44
    45
    46
    47
    48
    49
    50
    51
    52
    53
    54
    55
    56
    57
    58
    59
    60
    61
    62
    63
    64
    65
    66
    67
    68
    69
    70
    71
    72
    73
    74
    75
    76
    77
    78
    79
    80
    81
    82
    83
    84
    85
    86
    87
    88
    89
    90
    91
    92
    93
    94
    95
    96
    97
    98
    99
    100
    101
    102
    103
    104
    105
    106
    107
    108
    109
    110
    111
    112
    113
    114
    115
    116
    117
    118
    119
    120
    121
    122
    123
    124
    125
    126
    127
    128
    129
    130
    131
    132
    133
    134
    135
    136
    137
    138
    139
    140
    141
    142
    143
    144
    145
    146
        <link rel="stylesheet" href="https://cdn.jsdelivr.net/npm/ol@v10.1.0/ol.css" type="text/css" />
        <script src="https://cdn.jsdelivr.net/npm/ol@v10.1.0/dist/ol.js"></script>
        <script src="https://cdn.jsdelivr.net/npm/ol-mapbox-style@12.3.5/dist/olms.js" type="text/javascript"></script>
    
        <script src="https://unpkg.com/@esri/arcgis-rest-request@4.0.0/dist/bundled/request.umd.js"></script>
        <script src="https://unpkg.com/@esri/arcgis-rest-feature-service@4.0.0/dist/bundled/feature-service.umd.js"></script>
    
        <script src="https://unpkg.com/ol-popup@5.1.1/dist/ol-popup.js"></script>
        <link rel="stylesheet" href="https://unpkg.com/ol-popup@5.1.1/src/ol-popup.css" />
    
    Expand

Add layers

You will need two Vector layers. interactionLayer will display the query polygon while the user is drawing it. Once the query returns, parcelLayers will display the individual property parcels in the default style. Each contains a Vector source that initially contains no features.

In order to be able to draw shapes, you create a Draw Interaction, connected to your interactionLayer. By setting its type to Polygon, it only allows polygon features to be drawn.

  1. Add a map load handler to the olms initialization. Inside, define Vector layers parcelLayer and interactionLayer. Provide a black Stroke and blue Fill style for parcelLayer. Add each to the map with map.addLayer.

    Expand
    Use dark colors for code blocks
    1
    2
    3
    4
    5
    6
    7
    8
    9
    10
    11
    12
    13
    14
    15
    16
    17
    18
    19
    20
    21
    22
    23
    24
    25
    26
    27
    28
    29
    30
    31
    32
    33
    34
    35
    36
    37
    38
    39
    40
    41
    42
    43
    44
    45
    46
    47
    48
    49
    50
    51
    52
    53
    54
    55
    56
    57
    58
    59
    60
    61
    62
    63
    64
    65
    66
    67
    68
    69
    70
    71
    72
    73
    74
    75
    76
    77
    78
    79
    80
    81
    82
    83
    84
    85
    86
    87
    88
    89
    90
    91
    92
    93
    94
    95
    96
    97
    98
    99
    100
    101
    102
    103
    104
    105
    106
    107
    108
    109
    110
    111
    112
    113
    114
    115
    116
    117
    118
    119
    120
    121
    122
    123
    124
    125
    126
    127
    128
    129
    130
    131
    132
    133
    134
    135
    136
    137
    138
    139
    140
    141
    142
    143
    144
    145
    146
          olms.apply(map, basemapURL).then(function (map) {
    
            const parcelLayer = new ol.layer.Vector({
              source: new ol.source.Vector(),
              style: new ol.style.Style({
                stroke: new ol.style.Stroke({
                  color: "black"
                }),
                fill: new ol.style.Fill({
                  color: "hsl(200,80%,50%)"
                })
              })
            });
            const interactionLayer = new ol.layer.Vector({
              source: new ol.source.Vector()
            });
    
            map.addLayer(parcelLayer);
            map.addLayer(interactionLayer);
    
    Expand
  2. Create a Draw interaction, linked to interactionLayer, and with a type of Polygon. Add it to the map with map.addInteraction.

    Expand
    Use dark colors for code blocks
    1
    2
    3
    4
    5
    6
    7
    8
    9
    10
    11
    12
    13
    14
    15
    16
    17
    18
    19
    20
    21
    22
    23
    24
    25
    26
    27
    28
    29
    30
    31
    32
    33
    34
    35
    36
    37
    38
    39
    40
    41
    42
    43
    44
    45
    46
    47
    48
    49
    50
    51
    52
    53
    54
    55
    56
    57
    58
    59
    60
    61
    62
    63
    64
    65
    66
    67
    68
    69
    70
    71
    72
    73
    74
    75
    76
    77
    78
    79
    80
    81
    82
    83
    84
    85
    86
    87
    88
    89
    90
    91
    92
    93
    94
    95
    96
    97
    98
    99
    100
    101
    102
    103
    104
    105
    106
    107
    108
    109
    110
    111
    112
    113
    114
    115
    116
    117
    118
    119
    120
    121
    122
    123
    124
    125
    126
    127
    128
    129
    130
    131
    132
    133
    134
    135
    136
    137
    138
    139
    140
    141
    142
    143
    144
    145
    146
            map.addLayer(parcelLayer);
            map.addLayer(interactionLayer);
    
            const drawInteraction = new ol.interaction.Draw({
              source: interactionLayer.getSource(),
              type: "Polygon",
              stopClick: true // don't fire "click" events (needed later)
            });
    
            map.addInteraction(drawInteraction);
    
    Expand
  3. In the top right, click Run. You can now click to create multiple polygons.

Execute the query

Use the ArcGIS REST JS queryFeatures method to find features in the LA County Parcels feature layer that intersect the sketched feature. When the matching parcels are returned, use an EsriJSON feature format to read the features and add them to the parcel layer's source.

  1. Create a function called executeQuery with a geometry parameter and then call arcgisRest.queryFeatures.

  2. Pass the geometry. Specify JSON as the return type and specify returnGeometry. All of the features within the geometry will be returned.

    Expand
    Use dark colors for code blocks
    1
    2
    3
    4
    5
    6
    7
    8
    9
    10
    11
    12
    13
    14
    15
    16
    17
    18
    19
    20
    21
    22
    23
    24
    25
    26
    27
    28
    29
    30
    31
    32
    33
    34
    35
    36
    37
    38
    39
    40
    41
    42
    43
    44
    45
    46
    47
    48
    49
    50
    51
    52
    53
    54
    55
    56
    57
    58
    59
    60
    61
    62
    63
    64
    65
    66
    67
    68
    69
    70
    71
    72
    73
    74
    75
    76
    77
    78
    79
    80
    81
    82
    83
    84
    85
    86
    87
    88
    89
    90
    91
    92
    93
    94
    95
    96
    97
    98
    99
    100
    101
    102
    103
    104
    105
    106
    107
    108
    109
    110
    111
    112
    113
    114
    115
    116
    117
    118
    119
    120
    121
    122
    123
    124
    125
    126
    127
    128
    129
    130
    131
    132
    133
    134
    135
    136
    137
    138
    139
    140
    141
    142
    143
    144
    145
    146
            map.addInteraction(drawInteraction);
    
            function executeQuery(geometry) {
    
              arcgisRest
                .queryFeatures({
                  url: "https://services3.arcgis.com/GVgbJbqm8hXASVYi/arcgis/rest/services/LA_County_Parcels/FeatureServer/0",
                  geometry: geometry,
                  geometryType: "esriGeometryPolygon",
                  spatialRel: "esriSpatialRelIntersects",
                  f: "json",
                  returnGeometry: true
                })
    
            }
    
    Expand
  3. Add a response handler. Inside, use an EsriJSON feature format to set the returned parcels as the parcel layer's source.

    Expand
    Use dark colors for code blocks
    1
    2
    3
    4
    5
    6
    7
    8
    9
    10
    11
    12
    13
    14
    15
    16
    17
    18
    19
    20
    21
    22
    23
    24
    25
    26
    27
    28
    29
    30
    31
    32
    33
    34
    35
    36
    37
    38
    39
    40
    41
    42
    43
    44
    45
    46
    47
    48
    49
    50
    51
    52
    53
    54
    55
    56
    57
    58
    59
    60
    61
    62
    63
    64
    65
    66
    67
    68
    69
    70
    71
    72
    73
    74
    75
    76
    77
    78
    79
    80
    81
    82
    83
    84
    85
    86
    87
    88
    89
    90
    91
    92
    93
    94
    95
    96
    97
    98
    99
    100
    101
    102
    103
    104
    105
    106
    107
    108
    109
    110
    111
    112
    113
    114
    115
    116
    117
    118
    119
    120
    121
    122
    123
    124
    125
    126
    127
    128
    129
    130
    131
    132
    133
    134
    135
    136
    137
    138
    139
    140
    141
    142
    143
    144
    145
    146
            function executeQuery(geometry) {
    
              arcgisRest
                .queryFeatures({
                  url: "https://services3.arcgis.com/GVgbJbqm8hXASVYi/arcgis/rest/services/LA_County_Parcels/FeatureServer/0",
                  geometry: geometry,
                  geometryType: "esriGeometryPolygon",
                  spatialRel: "esriSpatialRelIntersects",
                  f: "json",
                  returnGeometry: true
                })
    
                .then((response) => {
                  const features = new ol.format.EsriJSON().readFeatures(response);
                  parcelLayer.getSource().addFeatures(features);
                });
    
            }
    
    Expand

Trigger the query

When the user completes a polygon, the drawend event is fired, with an object containing the new polygon as a feature attribute. You can use this feature to call executeQuery.

Use the EsriJSON feature format to convert the query polygon into the ArcGIS geometry format. It is not necessary to reproject the data.

  1. Add a handler for the drawEnd event. Inside, use an EsriJSON feature format to convert the feature into an ArcGIS JSON format. Ensure the map's spatial reference information is included, by setting the featureProjection property. Call executeQuery with this feature's geometry.

    Expand
    Use dark colors for code blocks
    1
    2
    3
    4
    5
    6
    7
    8
    9
    10
    11
    12
    13
    14
    15
    16
    17
    18
    19
    20
    21
    22
    23
    24
    25
    26
    27
    28
    29
    30
    31
    32
    33
    34
    35
    36
    37
    38
    39
    40
    41
    42
    43
    44
    45
    46
    47
    48
    49
    50
    51
    52
    53
    54
    55
    56
    57
    58
    59
    60
    61
    62
    63
    64
    65
    66
    67
    68
    69
    70
    71
    72
    73
    74
    75
    76
    77
    78
    79
    80
    81
    82
    83
    84
    85
    86
    87
    88
    89
    90
    91
    92
    93
    94
    95
    96
    97
    98
    99
    100
    101
    102
    103
    104
    105
    106
    107
    108
    109
    110
    111
    112
    113
    114
    115
    116
    117
    118
    119
    120
    121
    122
    123
    124
    125
    126
    127
    128
    129
    130
    131
    132
    133
    134
    135
    136
    137
    138
    139
    140
    141
    142
    143
    144
    145
    146
            map.addInteraction(drawInteraction);
    
            drawInteraction.on("drawend", (e) => {
              const feature = new ol.format.EsriJSON().writeFeatureObject(e.feature, {
                featureProjection: map.getView().getProjection()
              });
    
              executeQuery(feature.geometry);
    
            });
    
    Expand
  2. At the top right, click Run. When you draw a polygon, a spatial query will run against the feature layer and display all land parcels within the boundary of the feature. Interaction polygons and parcels returned from previous queries remain visible. You will address this next.

Add a pop-up

The parcels returned from the query contain many attributes, such as land value and land use type. You can make the parcels interactive by showing a pop-up when the user clicks on a parcel. You create a Popup to display parcel attributes. It is a type of Overlay so you add it to the map with map.addOverlay.

In order for clicking to trigger a pop-up, and not draw another polygon, you need to enable and disable the draw interaction using setActive. Disable the interaction when the user has drawn a complete polygon. Enable it again when the user clicks somewhere other than a parcel, to reset the map. Clear the parcels and interaction layer at the same time.

  1. Create a Popup and save it to a popup variable. Add it to the map with map.addOverlay.

    Expand
    Use dark colors for code blocks
    1
    2
    3
    4
    5
    6
    7
    8
    9
    10
    11
    12
    13
    14
    15
    16
    17
    18
    19
    20
    21
    22
    23
    24
    25
    26
    27
    28
    29
    30
    31
    32
    33
    34
    35
    36
    37
    38
    39
    40
    41
    42
    43
    44
    45
    46
    47
    48
    49
    50
    51
    52
    53
    54
    55
    56
    57
    58
    59
    60
    61
    62
    63
    64
    65
    66
    67
    68
    69
    70
    71
    72
    73
    74
    75
    76
    77
    78
    79
    80
    81
    82
    83
    84
    85
    86
    87
    88
    89
    90
    91
    92
    93
    94
    95
    96
    97
    98
    99
    100
    101
    102
    103
    104
    105
    106
    107
    108
    109
    110
    111
    112
    113
    114
    115
    116
    117
    118
    119
    120
    121
    122
    123
    124
    125
    126
    127
    128
    129
    130
    131
    132
    133
    134
    135
    136
    137
    138
    139
    140
    141
    142
    143
    144
    145
    146
                .then((response) => {
                  const features = new ol.format.EsriJSON().readFeatures(response);
                  parcelLayer.getSource().addFeatures(features);
                });
    
            }
    
            const popup = new Popup();
            map.addOverlay(popup);
    
    Expand
  2. Create a map click event handler. Inside, use map.getFeaturesAtPixel to get the clicked parcel, if any. If there is one, use popup.show to display a pop-up containing the parcel's APN, use type, land value and taxation city.

    Expand
    Use dark colors for code blocks
    1
    2
    3
    4
    5
    6
    7
    8
    9
    10
    11
    12
    13
    14
    15
    16
    17
    18
    19
    20
    21
    22
    23
    24
    25
    26
    27
    28
    29
    30
    31
    32
    33
    34
    35
    36
    37
    38
    39
    40
    41
    42
    43
    44
    45
    46
    47
    48
    49
    50
    51
    52
    53
    54
    55
    56
    57
    58
    59
    60
    61
    62
    63
    64
    65
    66
    67
    68
    69
    70
    71
    72
    73
    74
    75
    76
    77
    78
    79
    80
    81
    82
    83
    84
    85
    86
    87
    88
    89
    90
    91
    92
    93
    94
    95
    96
    97
    98
    99
    100
    101
    102
    103
    104
    105
    106
    107
    108
    109
    110
    111
    112
    113
    114
    115
    116
    117
    118
    119
    120
    121
    122
    123
    124
    125
    126
    127
    128
    129
    130
    131
    132
    133
    134
    135
    136
    137
    138
    139
    140
    141
    142
    143
    144
    145
    146
            const popup = new Popup();
            map.addOverlay(popup);
    
            map.on("click", (event) => {
              let parcel = map.getFeaturesAtPixel(event.pixel, {
                layerFilter: (l) => l === parcelLayer
              })[0];
              if (parcel) {
                // user clicked on a parcel to see more information about it
                const message =
                  `<b>Parcel ${parcel.get("APN")}</b>` +
                  `<br>Type: ${parcel.get("UseType")} <br>` +
                  `Land value: ${parcel.get("Roll_LandValue")} <br>` +
                  `Tax Rate City: ${parcel.get("TaxRateCity")}`;
    
                popup.show(event.coordinate, message);
                drawInteraction.abortDrawing();
              } else {
    
              }
            });
    
    Expand
  3. If the user did not click a parcel, hide the pop-up with popup.hide. Clear each layer by calling clear on its Source. Use setActive to enabledrawInteraction.

    Expand
    Use dark colors for code blocks
    1
    2
    3
    4
    5
    6
    7
    8
    9
    10
    11
    12
    13
    14
    15
    16
    17
    18
    19
    20
    21
    22
    23
    24
    25
    26
    27
    28
    29
    30
    31
    32
    33
    34
    35
    36
    37
    38
    39
    40
    41
    42
    43
    44
    45
    46
    47
    48
    49
    50
    51
    52
    53
    54
    55
    56
    57
    58
    59
    60
    61
    62
    63
    64
    65
    66
    67
    68
    69
    70
    71
    72
    73
    74
    75
    76
    77
    78
    79
    80
    81
    82
    83
    84
    85
    86
    87
    88
    89
    90
    91
    92
    93
    94
    95
    96
    97
    98
    99
    100
    101
    102
    103
    104
    105
    106
    107
    108
    109
    110
    111
    112
    113
    114
    115
    116
    117
    118
    119
    120
    121
    122
    123
    124
    125
    126
    127
    128
    129
    130
    131
    132
    133
    134
    135
    136
    137
    138
    139
    140
    141
    142
    143
    144
    145
    146
                popup.show(event.coordinate, message);
                drawInteraction.abortDrawing();
              } else {
    
                // user clicked elsewhere on the map to reset
                popup.hide();
                parcelLayer.getSource().clear();
                interactionLayer.getSource().clear();
                drawInteraction.setActive(true);
    
    Expand
  4. In the drawend event handler, use setActive to disable drawInteraction.

    Expand
    Use dark colors for code blocks
    1
    2
    3
    4
    5
    6
    7
    8
    9
    10
    11
    12
    13
    14
    15
    16
    17
    18
    19
    20
    21
    22
    23
    24
    25
    26
    27
    28
    29
    30
    31
    32
    33
    34
    35
    36
    37
    38
    39
    40
    41
    42
    43
    44
    45
    46
    47
    48
    49
    50
    51
    52
    53
    54
    55
    56
    57
    58
    59
    60
    61
    62
    63
    64
    65
    66
    67
    68
    69
    70
    71
    72
    73
    74
    75
    76
    77
    78
    79
    80
    81
    82
    83
    84
    85
    86
    87
    88
    89
    90
    91
    92
    93
    94
    95
    96
    97
    98
    99
    100
    101
    102
    103
    104
    105
    106
    107
    108
    109
    110
    111
    112
    113
    114
    115
    116
    117
    118
    119
    120
    121
    122
    123
    124
    125
    126
    127
    128
    129
    130
    131
    132
    133
    134
    135
    136
    137
    138
    139
    140
    141
    142
    143
    144
    145
    146
            drawInteraction.on("drawend", (e) => {
              const feature = new ol.format.EsriJSON().writeFeatureObject(e.feature, {
                featureProjection: map.getView().getProjection()
              });
    
              executeQuery(feature.geometry);
    
              drawInteraction.setActive(false);
    
    Expand

Run the app

In CodePen, run your code to display the map.

When you click on the map to draw a polygon, a spatial query will run against the feature layer and display all land parcels that intersect the boundary of the feature. You can click on a parcel to see a pop-up with information about the parcel, or click somewhere else to reset the map.

What's next?

Learn how to use additional ArcGIS location services in these tutorials:
Your browser is no longer supported. Please upgrade your browser for the best experience. See our browser deprecation post for more details.