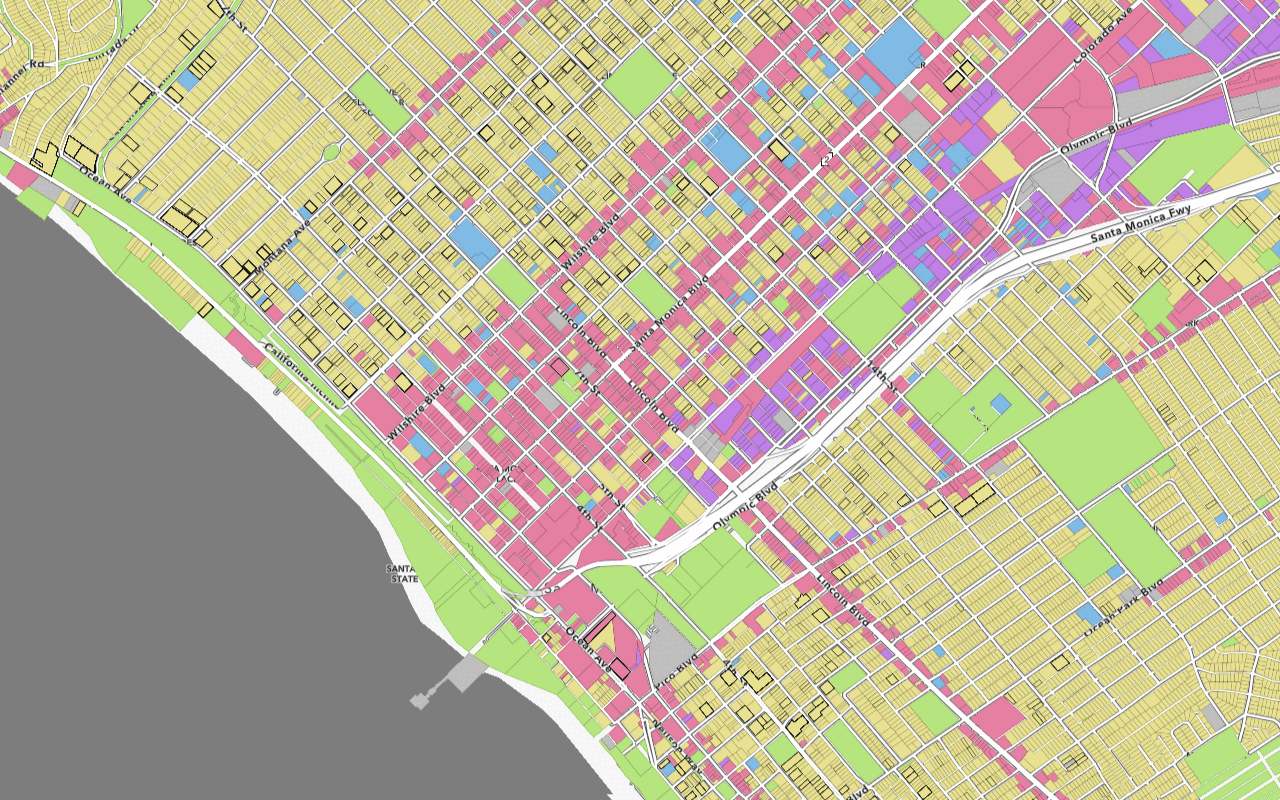
Learn how to use style feature layers.
A feature layer is a dataset in a feature service hosted in ArcGIS. Each feature layer contains features with a single geometry type (point, line, or polygon), and a set of attributes. Layers in OpenLayers can contain style functions, which use attribute values to change the appearance of features. This allows you to create complex, data-driven visualizations by relating visual variables to data attributes.
In this tutorial, you apply different styles to enhance the visualization of the Trailheads, Trails and Parks and Open Spaces feature layers.
Prerequisites
An ArcGIS Location Platform or ArcGIS Online account.
Steps
Get the starter app
Select a type of authentication below and follow the steps to create a new application.
Set up authentication
Create developer credentials in your portal for the type of authentication you selected.
Set developer credentials
Use the API key or OAuth developer credentials so your application can access location services.
Style trailheads with a hiker image and labels
A Style in OpenLayers has several possible components: an image, text, stroke, fill and so on. To display a hiker icon for the trailheads layer, you use an Icon style as the image component. Specify which image file as the src, and the size as the scale parameter.
To display the trailhead name, you use a Text style. Use a left value for text with an offset of 10 to display the labels to the right of the icons. Use Fill and Stroke styles as the fill and stroke properties to give the labels white text with a teal outline. The font property is a CSS font definition. Since the label for each trailhead is different, use a function to return a Style for a given feature. Set the text property using feature's TRL attribute.
-
Inside
olmsload handler, create atrailheadfunction that takes aStyle featureand returns aStylecontaining anIconstyle. Usehttpfor the://static.arcgis.com/images/ Symbols/ NP S/nps Pictograph _0231b.png srcand set ascaleof 25%.Use dark colors for code blocks const basemapId = "arcgis/outdoor"; const basemapURL = `https://basemapstyles-api.arcgis.com/arcgis/rest/services/styles/v2/styles/${basemapId}?token=${accessToken}`; olms.apply(map, basemapURL).then(function (map) { const trailheadStyle = function (feature) { return new ol.style.Style({ image: new ol.style.Icon({ src: "http://static.arcgis.com/images/Symbols/NPS/npsPictograph_0231b.png", scale: 0.25 }), -
Add a
Textstyle to display labels with white text, teal outline, in an italic sans-serif font. Set thetextproperty using the feature'sTRLattribute._NAME Use dark colors for code blocks const trailheadStyle = function (feature) { return new ol.style.Style({ image: new ol.style.Icon({ src: "http://static.arcgis.com/images/Symbols/NPS/npsPictograph_0231b.png", scale: 0.25 }), text: new ol.style.Text({ text: feature.get("TRL_NAME"), font: "italic 12px sans-serif", offsetX: 10, textAlign: "left", fill: new ol.style.Fill({ color: "#FFFFFF" }), stroke: new ol.style.Stroke({ color: "#5E8D74", width: 3 }) }) }); };
Add the Trailheads feature layer to the map
Use a Vector layer with a Vector source to display the trailheads.
For more information about adding feature layers using GeoJSON, see the Add a feature layer as GeoJSON tutorial.
-
Add a
Vectorlayer with aVectorsource to load and display the trailheads feature layer. Setdeclutterto be true to prevent label overlap. Pass thetrailheadsfunction as theStyle styleproperty. Usemap.addto add this layer to the map.Layer Use dark colors for code blocks stroke: new ol.style.Stroke({ color: "#5E8D74", width: 3 }) }) }); }; const trailheadsLayerName = "Trailheads"; const trailheadsLayerURL = "https://services3.arcgis.com/GVgbJbqm8hXASVYi/arcgis/rest/services/" + trailheadsLayerName + "/FeatureServer/0/query?where=1%3D1&outFields=*&returnGeometry=true&f=pgeojson"; const trailheadsLayer = new ol.layer.Vector({ source: new ol.source.Vector({ format: new ol.format.GeoJSON(), url: trailheadsLayerURL, }), style: trailheadStyle, declutter: true }); map.addLayer(trailheadsLayer); -
Add the data attribution for the feature layer source.
- Go to the Trailheads (Santa Monica Mountains) item.
- Scroll down to the Credits (Attribution) section and copy its value.
- Create an
attributionproperty and paste the attribution value from the item.Use dark colors for code blocks stroke: new ol.style.Stroke({ color: "#5E8D74", width: 3 }) }) }); }; const trailheadsLayerName = "Trailheads"; const trailheadsLayerURL = "https://services3.arcgis.com/GVgbJbqm8hXASVYi/arcgis/rest/services/" + trailheadsLayerName + "/FeatureServer/0/query?where=1%3D1&outFields=*&returnGeometry=true&f=pgeojson"; const trailheadsLayer = new ol.layer.Vector({ source: new ol.source.Vector({ format: new ol.format.GeoJSON(), url: trailheadsLayerURL, // Attribution text retrieved from https://arcgis.com/home/item.html?id=883cedb8c9fe4524b64d47666ed234a7 attributions: ['Los Angeles GeoHub |'] }), style: trailheadStyle, declutter: true }); map.addLayer(trailheadsLayer);
-
At the top right, click Run to test your map. You should see hiker icons and trailhead labels.
Style trail width by elevation gain
To visualize the elevation gain of a trail you can use the width of a Stroke style. To do this, create another function which returns a Style. The width of the style's stroke property will be a calculation converting feet of elevation gain to pixels of width.
-
Create a
trailfunction that takes aStyle featureand returns aStylewith aStrokestyle. Set thecolorto pink, and calculate thewidthproperty from the feature'sELEVattribute._GAIN Use dark colors for code blocks style: trailheadStyle, declutter: true }); map.addLayer(trailheadsLayer); const trailStyle = function (feature) { return new ol.style.Style({ stroke: new ol.style.Stroke({ color: "#BA55D3", width: 3 + (4 * feature.get("ELEV_GAIN")) / 2300 }) }); }; -
Add the Trails feature layer as a
Vectorlayer with a GeoJSONVectorsource. Pass yourtrailfunction as theStyle styleproperty. Useinsertto add this layer below the trailheads layer.At Use dark colors for code blocks const trailStyle = function (feature) { return new ol.style.Style({ stroke: new ol.style.Stroke({ color: "#BA55D3", width: 3 + (4 * feature.get("ELEV_GAIN")) / 2300 }) }); }; const trailsLayerName = "Trails"; const trailsLayerURL = "https://services3.arcgis.com/GVgbJbqm8hXASVYi/arcgis/rest/services/" + trailsLayerName + "/FeatureServer/0/query?where=1%3D1&outFields=*&returnGeometry=true&f=pgeojson"; const trailsLayer = new ol.layer.Vector({ source: new ol.source.Vector({ format: new ol.format.GeoJSON(), url: trailsLayerURL, }), style: trailStyle }); map.getLayers().insertAt(1, trailsLayer); -
Add the data attribution for the feature layer source.
- Go to the Trails item.
- Scroll down to the Credits (Attribution) section and copy its value.
- Create an
attributionproperty and paste the attribution value from the item.Use dark colors for code blocks const trailStyle = function (feature) { return new ol.style.Style({ stroke: new ol.style.Stroke({ color: "#BA55D3", width: 3 + (4 * feature.get("ELEV_GAIN")) / 2300 }) }); }; const trailsLayerName = "Trails"; const trailsLayerURL = "https://services3.arcgis.com/GVgbJbqm8hXASVYi/arcgis/rest/services/" + trailsLayerName + "/FeatureServer/0/query?where=1%3D1&outFields=*&returnGeometry=true&f=pgeojson"; const trailsLayer = new ol.layer.Vector({ source: new ol.source.Vector({ format: new ol.format.GeoJSON(), url: trailsLayerURL, // Attribution text retrieved from https://arcgis.com/home/item.html?id=69e12682738e467eb509d8b54dc73cbd attributions: ['Los Angeles GeoHub |'] }), style: trailStyle }); map.getLayers().insertAt(1, trailsLayer);
-
At the top right, click Run to test your map. You should see the hiking trails in pink with thicker lines for those with more elevation gain.
Add a filtered bike-only trails layer
To display bike-only trails, you can add another style function to display a dashed line for trails that allow biking. You can display a dashed line by passing an array of alternating stroke and gap segments length as the line property in a Stroke style.
The same source from the trails can be used.
-
Create a
bikefunction. If the feature has aTrails Style Yesvalue forUSE, return a white dashed_BIKE Strokestyle. Otherwise, do not return aStyle, so the feature will not be displayed.Use dark colors for code blocks style: trailStyle }); map.getLayers().insertAt(1, trailsLayer); const bikeTrailsStyle = function (feature) { if (feature.get("USE_BIKE") === "Yes") { return new ol.style.Style({ stroke: new ol.style.Stroke({ lineDash: [1, 4], color: "white", width: 2 }) }); } }; -
Add a
bikeusing the source fromTrails Layer trails, with theLayer bikefunction. Insert the layer above theTrails Style trails.Layer Use dark colors for code blocks stroke: new ol.style.Stroke({ lineDash: [1, 4], color: "white", width: 2 }) }); } }; const bikeTrailsLayer = new ol.layer.Vector({ source: trailsLayer.getSource(), style: bikeTrailsStyle }); map.getLayers().insertAt(2, bikeTrailsLayer); -
At the top right, click Run to test your map. You should now see the bike-accessible trails with a dashed line.
Style a polygon layer
You can use color to communicate the category of a feature, such as the type of a park or open space. Use a style function to returns a Fill style, in which you derive the color property from the feature's TYPE property.
-
Create a
parksfunction which returns aStyle Fillstyle. Look up the feature'sTYPEattribute in a table to give a different color forNatural Areas,Regionla Open Space,Local ParkandRegional Recreation Park. If the type is not one of these, make the color transparent.Use dark colors for code blocks const bikeTrailsLayer = new ol.layer.Vector({ source: trailsLayer.getSource(), style: bikeTrailsStyle }); map.getLayers().insertAt(2, bikeTrailsLayer); const parksStyle = function (feature) { const type = feature.get("TYPE"); const colorTable = { "Natural Areas": "#9E559C", "Regional Open Space": "#A7C636", "Local Park": "#149ECE", "Regional Recreation Park": "#ED5151" }; return new ol.style.Style({ fill: new ol.style.Fill({ color: colorTable[feature.get("TYPE")] || "transparent" }) }); }; -
Add the data attribution for the feature layer source.
- Go to the Parks and Open Space item.
- Scroll down to the Credits (Attribution) section and copy its value.
- Create an
attributionproperty and paste the attribution value from the item.Use dark colors for code blocks const bikeTrailsLayer = new ol.layer.Vector({ source: trailsLayer.getSource(), style: bikeTrailsStyle }); map.getLayers().insertAt(2, bikeTrailsLayer); const parksStyle = function (feature) { const type = feature.get("TYPE"); const colorTable = { "Natural Areas": "#9E559C", "Regional Open Space": "#A7C636", "Local Park": "#149ECE", "Regional Recreation Park": "#ED5151" }; return new ol.style.Style({ fill: new ol.style.Fill({ color: colorTable[feature.get("TYPE")] || "transparent" }) }); };
-
Create a
Vectorlayer with aVectorsource for the parks feature layer. Pass yourparksfunction as theStyle styleproperty, with a low opacity. Insert the parks layer below the trails layers.Use dark colors for code blocks return new ol.style.Style({ fill: new ol.style.Fill({ color: colorTable[feature.get("TYPE")] || "transparent" }) }); }; const parksLayerName = "Parks_and_Open_Space"; const parksLayerURL = "https://services3.arcgis.com/GVgbJbqm8hXASVYi/arcgis/rest/services/" + parksLayerName + "/FeatureServer/0/query?where=1%3D1&outFields=*&returnGeometry=true&f=pgeojson"; const parksLayer = new ol.layer.Vector({ source: new ol.source.Vector({ format: new ol.format.GeoJSON(), url: parksLayerURL, }), opacity: 0.2, style: parksStyle }); map.getLayers().insertAt(1, parksLayer);
Run the app
Run the app.
You should now see parks of different colors, beneath the trails and trailhead layers.What's next?
Learn how to use additional ArcGIS location services in these tutorials:


