Introduction to the map module
The ArcGIS API for Python is easy to learn and extremely useful for data scientists, GIS administrators, and GIS analysts. One of the features that makes this API so powerful is its integration with Jupyter Notebook. The interactive Jupyter Notebook environment is built around the concept of cells that can contain executable code or text and illustrative graphics written in Markdown format. Cells can be run in any order and any number of times. When a cell is run, its output is displayed immediately below the cell. This encourages tweaking and rerunning code until the perfect solution is found—illustrating the REPL paradigm in action.
Because it is a web application running in a browser, Jupyter Notebook supports the display of graphic outputs. Write a snippet of Python code to plot a bar chart of household income of a county, and the chart will be displayed right below the cell containing that code.
Jupyter Notebook is also a great medium to work with and explore spatial data. Using just a single line of code, a live interactive map can be inserted into a notebook. Another line of code can add content to that map that is the result of a search. That content can be added with its default symbology or using smart mapping the API can figure out how best to symbolize the data. Spatially Enabled DataFrame (SeDF) objects returned from a query for features in a feature layer can be visualized as a table in Jupyter Notebook.
Workflows, data connections, outputs in the form of illustrative charts and maps, informational text about conclusions — these can all be stored and worked with in a notebook. A Jupyter Notebook can become a functional record of a workflow that can be shared with anyone. All the recipient must do is run the cells to reproduce that workflow. Jupyter Notebook encourages research that is reproducible, since not only the findings, but the code used to arrive at them, are stored.
The arcgis.map module offers components for managing maps and scenes to visualize GIS data and analysis in a rich, user-friendly, and interactive way that is specifically designed to work with 2D or 3D data content.
The GIS object includes a map() method that returns an instance of the arcgis.map.Map class which can be used for displaying geographic locations and visualizing GIS content, including analysis results. The Map class creates a mapping widget utilizing the ArcGIS Maps SDK for Javascript powered by the modern backend architecture and processing of JupyterLab 4 and Notebook 7.
To use the map widget, call the gis.map() method and assign it to a variable that you can then query to bring up the widget in the notebook as a new Map object. Use the mode='3d' argument to create a new Scene.
from arcgis.gis import GIS
gis = GIS()
map1 = gis.map()
map1
scene1 = gis.map(mode="3D")
scene1
scene1.zoom = 4Quick start example
Next, let's quickly explore some examples of creating a map widget in a notebook, adding layers to it, and saving it as a web map item.
Creating a map widget in desired location
from arcgis.gis import GIS
# Create a GIS object, as an anonymous user for this example
gis = GIS()
Initializing a map widget to a location centers around that area:
map1 = gis.map("Paris")
map1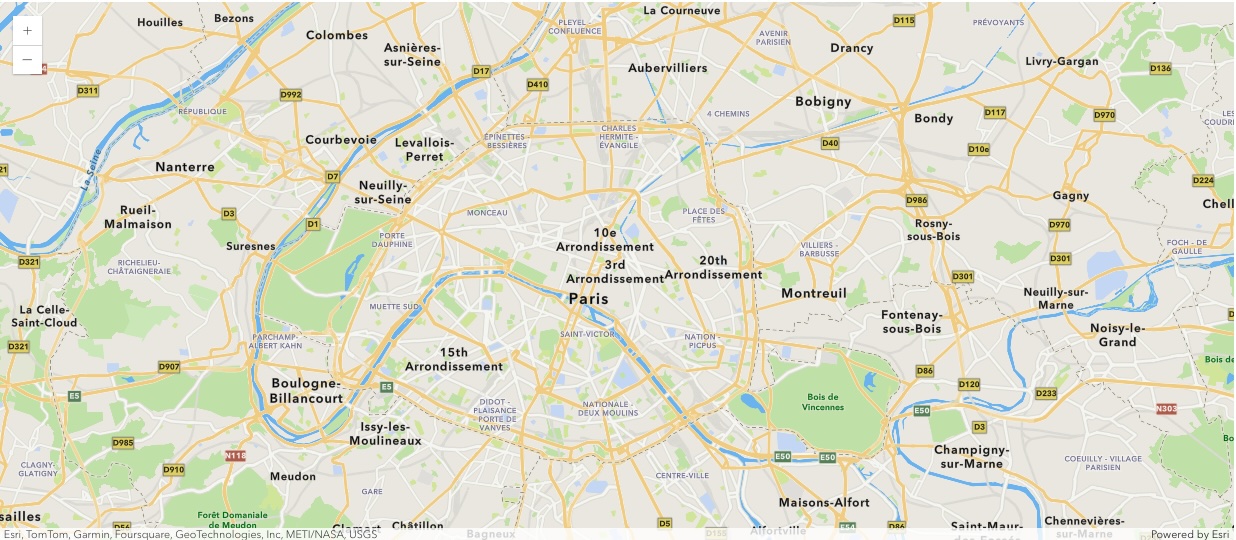
Adding layers to the map
An important functionality of the map widget is its ability to add and render web layers. To add a layer, access the content property on the map object to initialize a MapContent object, then access the add() method and pass Item, Layer, or Spatially Enabled DataFrame input to visualize data on the map:
# Log into to GIS as we will save the widget as a web map later
gis = GIS(profile="your_online_profile")
usa_map = gis.map('USA')  # you can specify the zoom level when creating a map
usa_map
Note: Screenshot above will appear after running the cells in the Adding layer objects to the map section of this guide.
usa_map.center = [39, -98]usa_map.zoom = 6Add search results to the map
Next, search via your GIS instance to add the desired result to the map:
flayer_search_result = gis.content.search("owner:esri","Feature Layer", outside_org=True)
flayer_search_result
[<Item title:"USA Soils Map Units" type:Feature Layer Collection owner:esri>, <Item title:"USA Traffic Counts" type:Feature Layer Collection owner:esri>, <Item title:"World Exclusive Economic Zone Boundaries" type:Feature Layer Collection owner:esri>, <Item title:"US Vessel Traffic 2016 April" type:Feature Layer Collection owner:esri>, <Item title:"US Vessel Traffic 2016 July" type:Feature Layer Collection owner:esri>, <Item title:"US Vessel Traffic 2016 June" type:Feature Layer Collection owner:esri>, <Item title:"US Vessel Traffic 2016 August" type:Feature Layer Collection owner:esri>, <Item title:"US Vessel Traffic 2016 December" type:Feature Layer Collection owner:esri>, <Item title:"US Vessel Traffic 2015 September" type:Feature Layer Collection owner:esri>, <Item title:"US Vessel Traffic 2017 August" type:Feature Layer Collection owner:esri>]
usa_map.content.add(flayer_search_result[1])world_timezones_item = gis.content.get('312cebfea2624e108e234220b04460b8')
usa_map.content.add(world_timezones_item)Adding layer objects to the map
You can add a number of different layer objects, such as FeatureLayer, FeatureCollection, ImageryLayer, and MapImageLayer to name a few, to the map. For example, you can add a FeatureLayer, as shown below:
world_countries_item = gis.content.get('ac80670eb213440ea5899bbf92a04998')
world_countries_layer = world_countries_item.layers[0]
world_countries_layer
<FeatureLayer url:"https://services.arcgis.com/P3ePLMYs2RVChkJx/arcgis/rest/services/World_Countries/FeatureServer/0">
usa_map.content.add(world_countries_layer, options={'opacity':0.4})Saving the map as a web map
You can save the map widget as a web map in your GIS. This process persists all the basemaps, layers added with symbology (custom or smart mapping), pop-ups, extent, and graphics in your web map.
To save a new Web Map item, call the save() method initialized from a new map widget. This method creates and returns a new Item object of type Web Map. As parameters, you can specify all valid Item properties as shown below:
Note: Must be signed into an organization in order to save a web map
gis = GIS(profile="web_gis_user")webmap_properties = {'title':'USA time zones and traffic counts WebMap',
'snippet': 'Jupyter notebook widget saved as a web map',
'tags':['automation', 'python']}
webmap_item = usa_map.save(
item_properties = webmap_properties,
)
print(webmap_item)<Item title:"USA time zones and traffic counts WebMap" type:Web Map owner:web_gis_user>
type(webmap_item)arcgis.gis.Item
Adding Map Service Layers to the map
import warnings
warnings.filterwarnings("ignore", "Warning")
from arcgis.gis import GIS
gis = GIS(profile="your_online_profile")map_svc_item = gis.content.get("1d39e5b4a7ed49a180ade7ed380deb8f")map_svc_item
map_svc_item.type'Map Service'
for lyr in map_svc_item.layers:
    print(f"{lyr.properties.name:30}{lyr.properties.type}")
Energov_Layers Group Layer Important_Farmland Feature Layer
ms_map = gis.map("Riverside County, California")
ms_map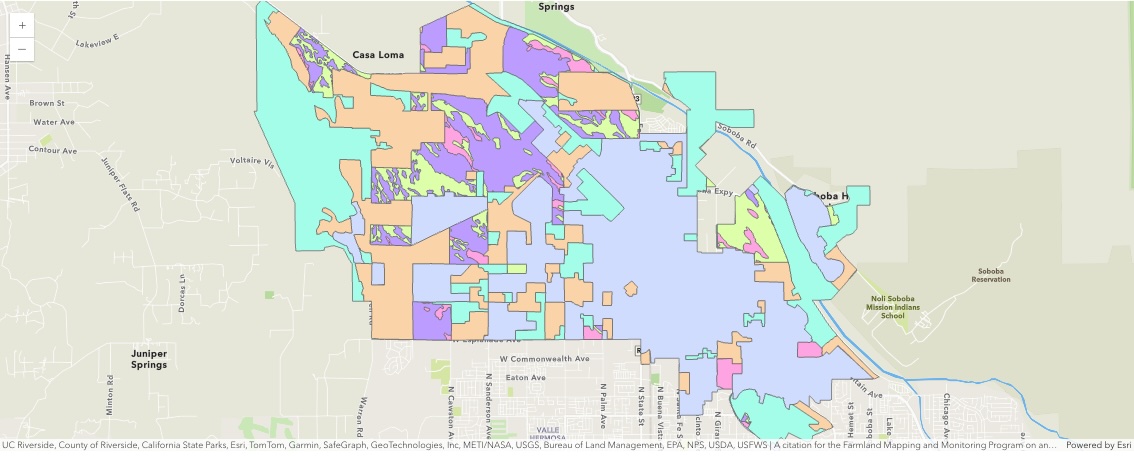
Note: Screenshot above will appear after running the next 3 cells.
ms_map.content.add(
    item=map_svc_item
)ms_map.content.layers[<MapImageLayer url:"https://gis01.city.sanjacintoca.gov/server/rest/services/Important_Farmland/MapServer">]
ms_map.zoom_to_layer(ms_map.content.layers[0])You can use this web map back in the notebook or in any ArcGIS app capable of rendering web maps. To learn how you can read this web map using the Python API, refer to the other parts of this notebook guide series.
An Object Diagram of the new Map Module
# Class Diagram for 2.4
Conclusion
In Part 1 of this guide series, we have explored the basic concepts and uses of web maps and quickly walked through some starter examples of visualizing layers on a map widget. In the following chapters we will discuss more advanced topics of mapping with the map widget.