# Import Libraries
from arcgis.gis import GIS
from arcgis.geoenrichment import Country, create_report, BufferStudyArea
# Create a GIS Connection
gis = GIS(profile='your_online_profile')Generating Reports
GeoEnrichment also enables you to create many types of high quality reports for a variety of use cases describing the input area. These reports can be generated in PDF or Excel formats containing relevant information on demographics, consumer spending, tapestry market, etc. for the area. You can find a sample PDF report here.
Find details about a wide variety of existing reports here.
Available Reports
The reports property of a Country object lists its available reports as a Pandas DataFrame. Let's look at available reports for some countires. The report id you see below is used as an input in the create_report() method to create reports.
Reports Available for U.S.
# Get Country
usa = Country.get('USA')
# print a sample of the reports available for USA
usa.reports.head(10)| id | title | categories | formats | |
|---|---|---|---|---|
| 0 | census2010_profile | 2010 Census Profile | [Demographics] | [pdf, xlsx] |
| 1 | census2020_profile | 2020 Census Profile | [Demographics] | [pdf, xlsx] |
| 2 | acs_housing | ACS Housing Summary | [Demographics] | [pdf, xlsx] |
| 3 | acs_keyfacts | ACS Key Population & Household Facts | [Demographics] | [pdf, xlsx] |
| 4 | acs_population | ACS Population Summary | [Demographics] | [pdf, xlsx] |
| 5 | 55plus | Age 50+ Profile | [Demographics] | [pdf, xlsx] |
| 6 | agesexrace | Age by Sex by Race Profile | [Demographics] | [pdf, xlsx] |
| 7 | agesex | Age by Sex Profile | [Demographics] | [pdf, xlsx] |
| 8 | cex_auto | Automotive Aftermarket Expenditures | [Consumer Spending] | [pdf, xlsx] |
| 9 | business_loc | Business Locator | [Business] | [pdf] |
# total number of reports available
usa.reports.shape
(52, 4)
We can see that there are 52 reports available for United States along with their title, categoriies and the available formats.
Reports Available for Another Country
Let's look at the reports available for Australia.
# Get Country
aus = Country.get('Australia')
# print a sample of the reports available for USA
aus.reports.head(20)| id | title | categories | formats | |
|---|---|---|---|---|
| 0 | AustraliaSummaryReport | Australia Summary Report | [Summary Reports] | [pdf, xlsx] |
| 1 | Custom_Map_Landscape | Custom Map Landscape | [Maps] | [pdf] |
| 2 | Custom_Map_Portrait | Custom Map Portrait | [Maps] | [pdf] |
| 3 | DemographicandIncomeProfileReport | Demographic and Income Profile Report (ABS) | [Demographics] | [pdf, xlsx] |
| 4 | site_map | Site Map | [Maps] | [pdf] |
| 5 | site_map_imagery04 | Site Map on Satellite Imagery - 0.4 Miles Wide | [Maps] | [pdf] |
| 6 | site_map_imagery08 | Site Map on Satellite Imagery - 0.8 Miles Wide | [Maps] | [pdf] |
| 7 | site_map_imagery16 | Site Map on Satellite Imagery - 1.6 Miles Wide | [Maps] | [pdf] |
# total number of reports available
aus.reports.shape
(8, 4)
Creating Reports
Here we see that Australia has 8 reports available along with their title, categories and the available formats. Details about different categories of reports can be found here.
The create_report method allows you to create many types of high quality reports for a variety of use cases describing the input area. Let's look at some examples of creating reports for some study areas. To learn more about Study Areas, refer to Enriching Study Areas guide.
Note: The report id must be used as an input in the create_report() method to create reports.
Report for Single Line Address
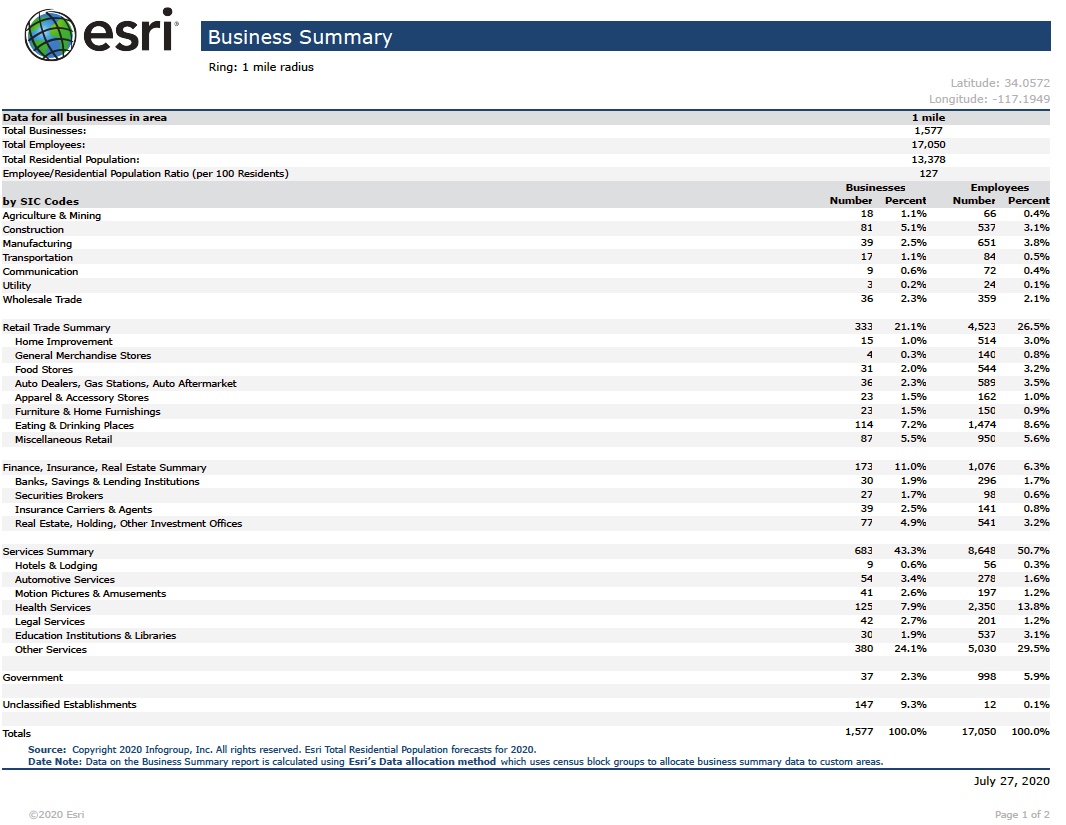
Let's create a report for an address using the Business Summary business_summary report id.
address_report = create_report(study_areas=["380 New York Street, Redlands, CA"],
                     report="business_summary",
                     export_format="PDF",
                     out_folder=r"reports",
                     out_name="esri_add_business_summary.pdf")
address_report
'reports\\esri_add_business_summary.pdf'
You can view the pdf report in reports folder on your disk. Here is a snapshot of how part of your report will look like in Pdf.

Report for Buffered Locations
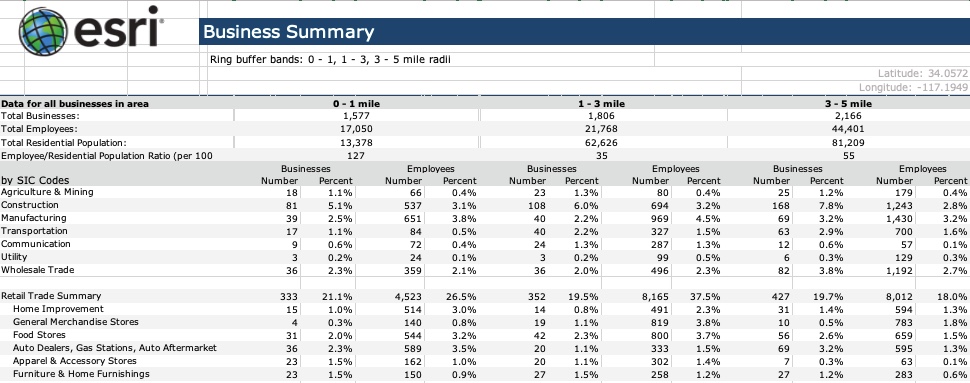
Reports can also be created for one or more buffered rings, or drive time service areas around the points of interest. Let's create a report for a street address with non-overlapping disks of radii 1, 3 and 5 Miles respectively using the Business Summary report template report="business_summary".
We will export this report as a Microsoft Excel file using the XLSX export format.
buffered = BufferStudyArea(area='380 New York St Redlands CA 92373',
                           radii=[1,3,5], units='Miles', overlap=False)
buffered_report = create_report(study_areas=[buffered],
report="business_summary",
export_format="XLSX",
out_folder=r"reports",
out_name="esri_buffered_business_summary.xlsx")
buffered_report'reports\\esri_buffered_business_summary.xlsx'
Here is a snapshot of how part of your report will look like in Excel.

Using options
options parameter can be specified for the study area buffer. Let's look at an example.
Note: By default a 1 mile radius buffer will be applied to points and address locations to define a study area.
# Define options
area_options={"areaType":"RingBuffer","bufferUnits":"esriMiles","bufferRadii":[1,3,5]}
# Create report
areaOptions_report = create_report(study_areas=["380 New York Street, Redlands, CA"],
report="business_summary",
export_format="XLSX",
options= area_options,
out_folder=r"reports",
out_name="studyAreaOptions_business_summary.xlsx")
areaOptions_report'reports\\studyAreaOptions_business_summary.xlsx'
Report for a Point Feature
When a point is used as a study area, the service will automatically create a 1 mile ring buffer around the point to collect and append enrichment data. We will use the Business Location business_loc report to enrich() our point feature.
# Create point geometry
from arcgis.geometry import Point
pt = Point({"x" : -118.15, "y" : 33.80, "spatialReference" : {"wkid" : 4326}})
# Create report
pt_report = create_report(study_areas=[pt],
report="business_loc",
export_format="PDF",
out_folder=r"reports",
out_name="esri_pt_business_profile.pdf")
pt_report'reports\\esri_pt_business_profile.pdf'
Report for a Polygon Study Area
Let's create a polygon and use the Laborforce Profile business_loc report to enrich() our polygon.
# Create polygon geometry
from arcgis.geometry import Polygon
poly = Polygon({"rings":[[[-117.26,32.81],[-117.40,32.92],[-117.12,32.80],[-117.26,32.81]]],
                "spatialReference":{"wkid":4326}})
# Create report
poly_report = create_report(study_areas=[poly],
report="business_loc",
export_format="PDF",
out_folder=r"reports",
out_name="esri_poly_business_profile.pdf")
poly_report'reports\\esri_poly_business_profile.pdf'
Customizing Reports
Reports can be customized by specifying optional paramaters. Report header can be customzied to include title, subtitle and logo etc. Parameters can also be specified to explicitly call the country or dataset to query. Let's look at some examples of customizing reports.
Using report_fields
Optional parameter report_fields specifies additional choices to customize reports. For example, the title, subtitle, logo, etc., which appear in the header of a report can be customized with this parameter. Let's look at an example by customizing report title, subtitle and logo.
# Define report fields
custom_fields={"title": "My Report",
               "subtitle": "Produced by My Company"}
# Create report
customFields_report = create_report(study_areas=["380 New York Street, Redlands, CA"],
report="business_summary",
export_format="PDF",
report_fields= custom_fields,
out_folder=r"reports",
out_name="customFields_business_summary.pdf")
customFields_report'reports\\customFields_business_summary.pdf'
Here is a snapshot of how custom fields (highlighted in red boxes) look like in a report.

Using use_data
In order to explicitly call the country or dataset to query, the use_data parameter can be specified. This parameter can be specified to provide an additional "performance hint" to the service.
By default, the service will automatically determine the country or dataset that is associated with each location or area submitted in the study_areas parameter. Narrowing down the query to a specific dataset or country through this parameter will potentially improve response time.
Let's look at an example of how use_data is used to indicate to the service that all input features in the study_areas parameter describe locations or areas only discoverable in the U.S. USA_ESRI_2024 dataset.
# Define data
useData={"sourceCountry":"US","dataset":"USA_ESRI_2024"}
# Create report
useData_report = create_report(study_areas=["380 New York Street, Redlands, CA"],
report="business_summary",
export_format="XLSX",
use_data= useData,
out_folder=r"reports",
out_name="useData_business_summary.xlsx")
useData_report'reports\\useData_business_summary.xlsx'
Conclusion
In this part of the arcgis.geoenrichment module guide series, you saw how GeoEnrichment also enables you to create different types of high quality reports. You explored the reports property of a Country object to list available reports. You experienced, in detail, how create_report method allows you to create rich reports for various study areas. Towards the end, you saw how these reports can be customized as well.
In the next and final page, you will learn about Standard Geography Queries.