Read HTML table to Pandas Data Frame
Often we read informative articles that present data in a tabular form. If such data contains location information, it would be much more insightful if presented as a cartographic map. Thus this sample shows how Pandas can be used to extract data from a table within a web page (in this case, a Wikipedia article) and how it can be then brought into the GIS for further analysis and visualization.
Note: to run this sample, you need a few extra libraries in your conda environment. If you don't have the libraries, install them by running the following commands from cmd.exe or your shell
conda install lxml
conda install html5lib
conda install beautifulsoup4
conda install matplotlib
import pandas as pd

from arcgis.gis import GIS
Let us read the Wikipedia article on Estimated number of guns per capita by country as a pandas data frame object
df = pd.read_html("https://en.wikipedia.org/wiki/Number_of_guns_per_capita_by_country")[0]df.shape(230, 10)
Let us process the table by dropping an unnecessary column.
df.head()| Location | Firearms per 100 | Region | Subregion | Population 2017 | Civilian firearms | Computation method | Registered firearms | Unregistered firearms | Notes | |
|---|---|---|---|---|---|---|---|---|---|---|
| 0 | United States | 120.5 | Americas | North America | 326474000 | 393347000 | 1 | 1073743.0 | 392,273,257 Est. | [note 2] |
| 1 | Falkland Islands | 62.1 | Americas | South America | 3000 | 2000 | 2 | 1705.0 | 295 | NaN |
| 2 | Yemen | 52.8 | Asia | Western Asia | 28120000 | 14859000 | 2 | NaN | NaN | NaN |
| 3 | New Caledonia | 42.5 | Oceania | Melanesia | 270000 | 115000 | 2 | 55000.0 | 60000 | NaN |
| 4 | Serbia | 39.1 | Europe | Southern Europe | 6946000 | 2719000 | 2 | 1186086.0 | 1532914 | NaN |
del df['Notes']df.head()| Location | Firearms per 100 | Region | Subregion | Population 2017 | Civilian firearms | Computation method | Registered firearms | Unregistered firearms | |
|---|---|---|---|---|---|---|---|---|---|
| 0 | United States | 120.5 | Americas | North America | 326474000 | 393347000 | 1 | 1073743.0 | 392,273,257 Est. |
| 1 | Falkland Islands | 62.1 | Americas | South America | 3000 | 2000 | 2 | 1705.0 | 295 |
| 2 | Yemen | 52.8 | Asia | Western Asia | 28120000 | 14859000 | 2 | NaN | NaN |
| 3 | New Caledonia | 42.5 | Oceania | Melanesia | 270000 | 115000 | 2 | 55000.0 | 60000 |
| 4 | Serbia | 39.1 | Europe | Southern Europe | 6946000 | 2719000 | 2 | 1186086.0 | 1532914 |
Let's process column names so there are no spaces because this can cause inconsistencies with some GIS operations:
df.columns = df.columns.str.replace(" ", "_")df.head()| Location | Firearms_per_100 | Region | Subregion | Population_2017 | Civilian_firearms | Computation_method | Registered_firearms | Unregistered_firearms | |
|---|---|---|---|---|---|---|---|---|---|
| 0 | United States | 120.5 | Americas | North America | 326474000 | 393347000 | 1 | 1073743.0 | 392,273,257 Est. |
| 1 | Falkland Islands | 62.1 | Americas | South America | 3000 | 2000 | 2 | 1705.0 | 295 |
| 2 | Yemen | 52.8 | Asia | Western Asia | 28120000 | 14859000 | 2 | NaN | NaN |
| 3 | New Caledonia | 42.5 | Oceania | Melanesia | 270000 | 115000 | 2 | 55000.0 | 60000 |
| 4 | Serbia | 39.1 | Europe | Southern Europe | 6946000 | 2719000 | 2 | 1186086.0 | 1532914 |
gis = GIS(profile="your_online_admin_profile")dpath = r"/Users/user_name/Job/"
df.to_csv(path_or_buf=dpath + "worldwide_gun_ownwership_df.csv", index=False)Plot as a map
Let us connect to our GIS to geocode this data and present it as a map, either by specifying username and password, for example in gis = GIS("https://www.arcgis.com", "your_org_username", "your_password") or via an existing profile:
from arcgis.gis import GIS
import json

#gis = GIS("home")
gis = GIS(profile="your_online_admin_profile")
The table is using the Location column to signify the country name, so we'll create a feature collection by passing the mapping relationship below to the Geocoder through the import_data() method:
df.columnsIndex(['Location', 'Firearms per 100', 'Region', 'Subregion',
'Population 2017', 'Civilian firearms', 'Computation method',
'Registered firearms', 'Unregistered firearms'],
dtype='object')fc = gis.content.import_data(df, {"CountryCode":"Location"})gun_fset = fc.query()map1 = gis.map(
location = 'Brazil'
)map1
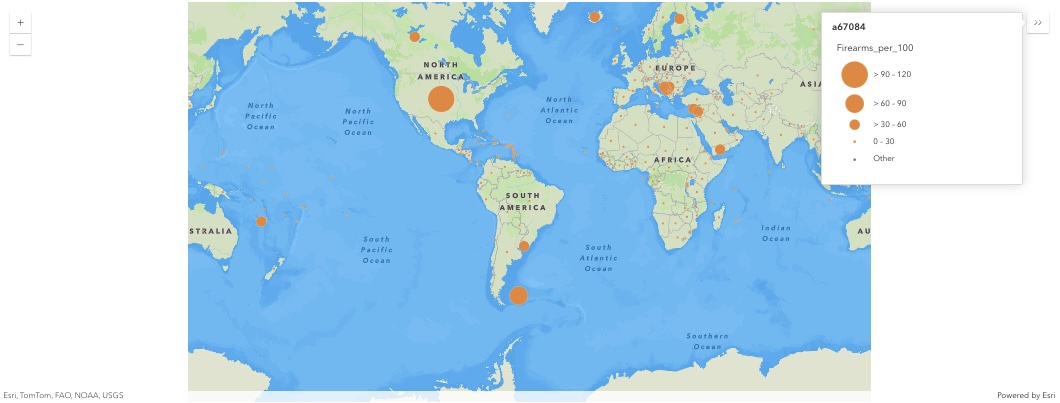
map1.zoom = 1We'll use smart mapping to render the points with varying sizes representing the number of firearms per 100 residents
map1.content.add(gun_fset)smart_map_mgr = map1.content.renderer(0).smart_mapping()
smart_map_mgr.class_breaks_renderer(
break_type="size",
field="Firearms_per_100",
num_classes=4
)map1.legend.enabled=TruePublish as Portal Item
Let us publish this layer as a feature collection item in our GIS
Let's use the FolderManager to get the logged in user's Root folder and add the Feature Collection to the folder.
fmgr = gis.content.foldersroot = fmgr.get(owner=gis.users.me)from arcgis.gis import ItemProperties, ItemTypeEnumiprops = ItemProperties(title="Worldwide Firearms Ownership Folder stream",
item_type=ItemTypeEnum.FEATURE_COLLECTION,
tags=["guns,violence"],
snippet = "GSR Worldwide firearms ownership",
description = "test description",
type_keywords = ["Data", "Feature Collection", "Singlelayer"],
extent = "-102.5272,-41.7886,172.5967,64.984")rf_item = root.add(item_properties=iprops,
text = json.dumps({"layers": [dict(fc.properties)]}))rf_item.result()