What is line of sight analysis?
3D line of sight analysis is a type of visibility analysis that calculates whether a target location is visible from an observer location and renders a line indicating visibility to the scene view. You can perform it in real-time to dynamically update whenever an observer or target moves.
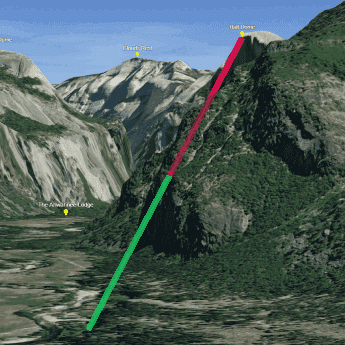
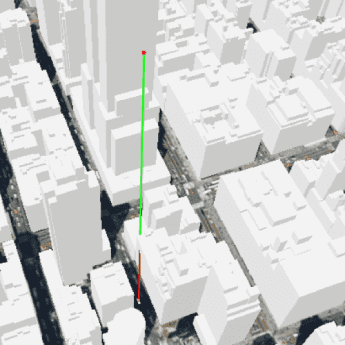
The line returned by the analysis contains two segments based on what can be seen by the observer and what is obstructed. Starting from the observer, the line displays with a color indicating visibility (the default is green) until it encounters an obstruction, and afterward the remaining segment displays with a color indicating that the view is obstructed (the default is red).
Line of sight analysis requires that you specify observer and target locations, which can be either a point location or a geoelement. The observer and target parameters must be of the same type.
Line of sight analysis has practical applications in architecture, military science, and many other fields.
Real-world use cases for line of sight analysis include the following:
- Designing civic structures such as roads and theatres.
- Minimizing the visibility of oil rigs and junkyards in urban areas.
- Preserving key views of famous landmarks and parks in city skylines.
Types of line of sight operations
The following table describes the different types of 3D line of sight operations:
| Operation | Description | Example |
|---|---|---|
Location, Line | Performs a line of sight analysis between two point locations in a scene. |

|
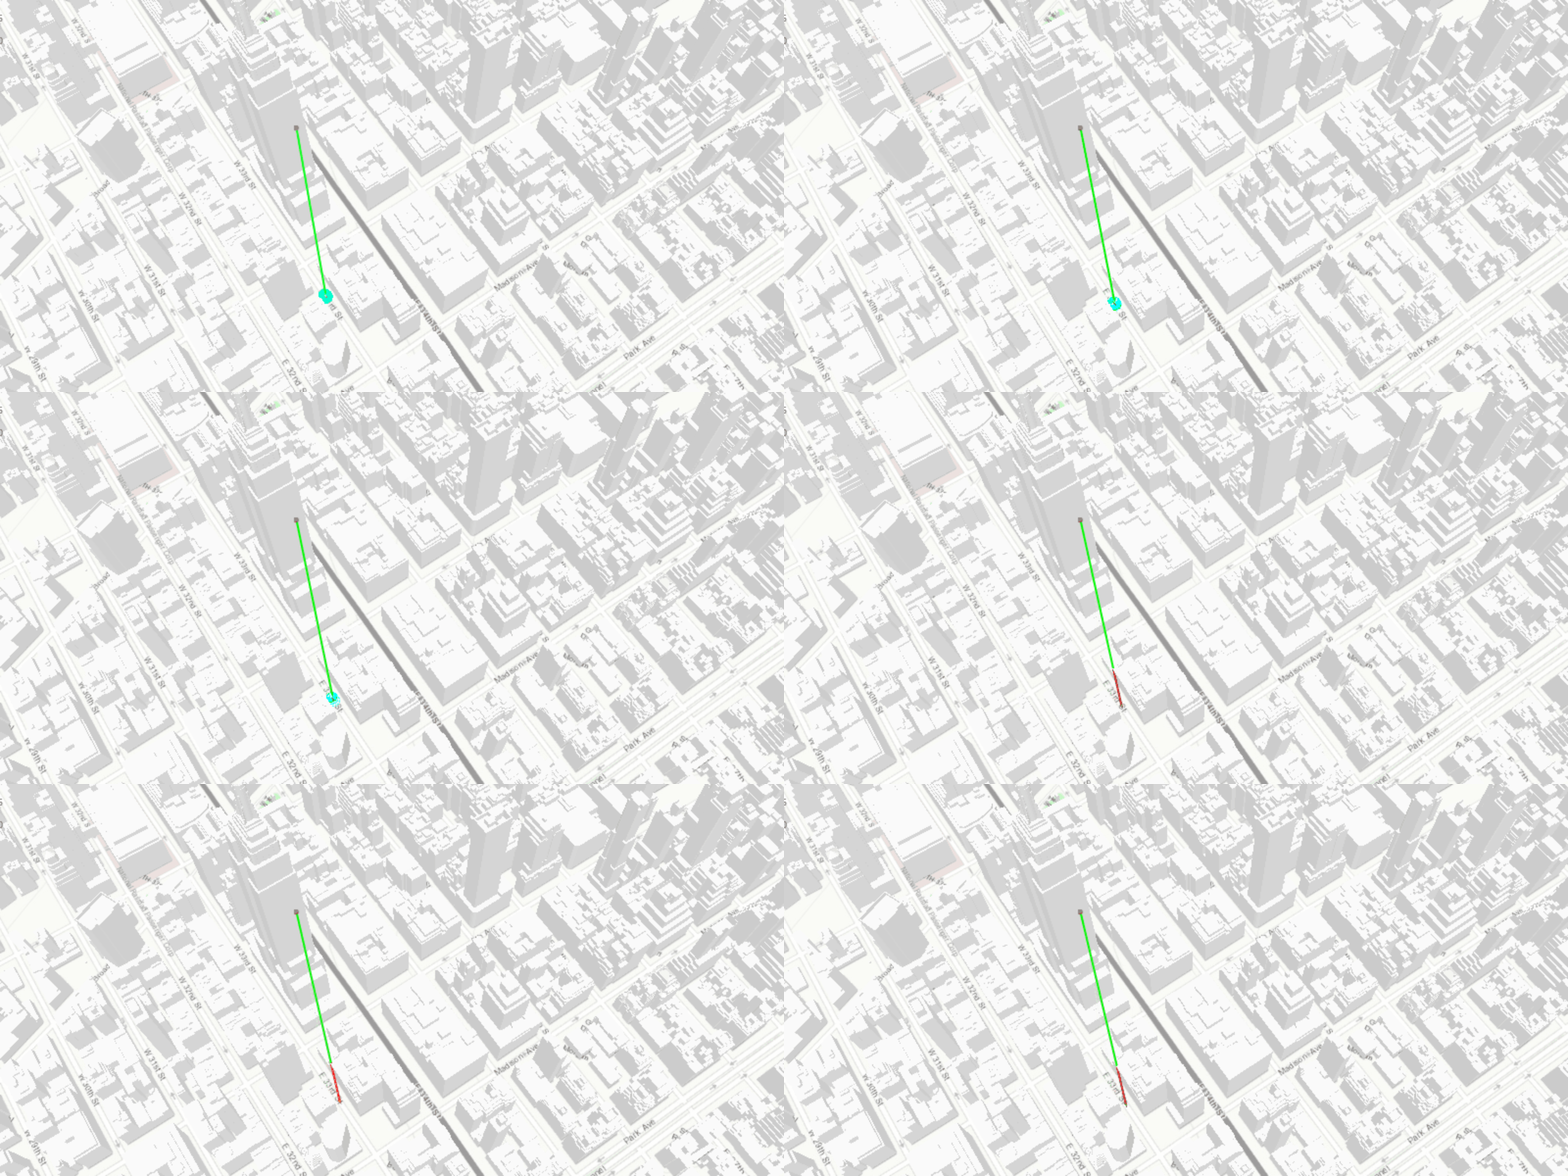
Geo | Performs a line of sight analysis between two geoelements in a scene. |

|
How to perform a line of sight analysis
The general steps to perform a line of sight analysis are as follows:
-
Create a scene view and set its extent to the desired location.
-
Create a point or geoelement to serve as an observer, then create a second to serve as a target.
-
Create a
Lineanalysis that matches the type of your observer and target.Of Sight -
Add the
Lineanalysis to the scene view to display the results.Of Sight
Code examples
Display a line of sight (Point)
This example performs and displays a line of sight analysis in a scene view at the provided observer and target locations (3D points). Line of sight analysis can be performed by either using the analysis operation directly or using the JavaScript Line widget.
viewModel.observer = new Point({
latitude: 37.7462,
longitude: -119.5743,
z: 1300
});
viewModel.targets = [
createTarget(37.7339, -119.6377, 2300), // El capitan
createTarget(37.7459, -119.5332, 2700), // Half dome
createTarget(37.7130, -119.6046, 2300), // Taft point
createTarget(37.7566, -119.5969, 2250), // Yosemite falls
createTarget(37.7569, -119.5599, 2300), // North dome
createTarget(37.7677, -119.4894, 2800), // Clouds rest
createTarget(37.7230, -119.5843, 2450), // Sentinel Dome
createTarget(37.7248, -119.5333, 1800) // Nevada falls
];
function createTarget(lat, lon, z) {
return {
location: new Point({
latitude: lat,
longitude: lon,
z: z || 0
})
};
}
Display a line of sight (GeoElement)
This example performs and displays a line of sight analysis in a scene view at the provided observer (taxi) and target (building) geoelements, updating the analysis dynamically whenever the geoelement taxi changes position.

private void CreateLineOfSight(GeoElement observer, GeoElement target)
{
_geoLine = new GeoElementLineOfSight(_observerGraphic, _taxiGraphic)
_analysisOverlay.Analyses.Add(_geoLine);
SceneView.AnalysisOverlays.Add(_analysisOverlay);
}