Note: Sign in to access the data in this sample. username password
Getting Started
Knowledge graphs allow you to model real-world systems that contain both spatial and nonspatial entities--such as people, places and things--and the relationships that connect them, allowing you to leverage both spatial and nonspatial tools in your analysis. A knowledge graph allows you work with a graph network. Both entities and relationships are objects in the graph data structure and can have associated properties. Entity types can be defined with or without spatial information.
Web link charts contain a link chart layer with the data from your knowledge graph and are loaded in a link chart view. Web link charts are a new core view (like MapView and SceneView) that are specifically for visually representing and analyzing all or part of a knowledge graph. They extend WebMaps and are built on the same core technology allowing you to leverage existing tools and patterns while also adding some additional link chart specific capabilities for refining your link chart visualizations and conducting graph analysis.
A link chart has one active link chart layer with sublayers for each entity type and relationship type in the knowledge graph.
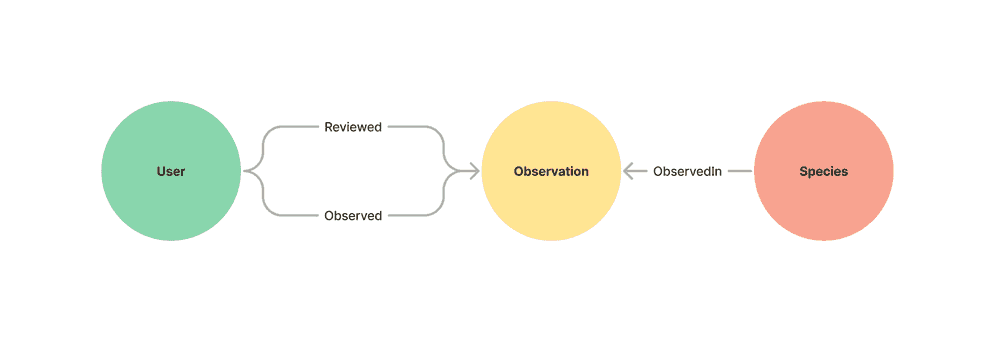
The sample dataset contains observations of bumble bees made at locations around the United States. Each observation was made and verified by users and is of a specific species of bumble bee.
Known Limitations
Link charts can only be used with KnowledgeGraphServices on ArcGIS Enterprise 11.1 or later. Link charts can only be saved as portal content items on ArcGIS Enterprise 11.3 or later.
For additional information on working with knowledge graph services see:
- Introduction to Knowledge Graph in the JavaScript SDK.
- Search a knowledge graph
- Query a knowledge graph
- Edit knowledge graph data
- Get started with ArcGIS Knowledge Server for overview of ArcGIS Knowledge for ArcGIS Enterprise.
- Hosted Knowledge Graph Service for information on managing knowledge graph services via ArcGIS Enterprise and the REST API.
How it works
To create a LinkChartLayer from a knowledge graph service, set the url property to the REST endpoint of the service.
A LinkChartLayer also optionally takes an inclusion definition.
The inclusion definition specifies a set of entity and relationship types and/or specific entities and relationships to be
included in the layer. A link chart always has explicit membership so if the initializationInclusionModeDefinition is not
defined then an inclusionModeDefinition will be created from the entire knowledge graph at the point that the layer created.
This sample illustrates how to use an inclusion definition to only include the research grade Observations and the Users who Observed or Reviewed those observations in the layer.
These specific observations and users are determined by first querying the knowledge graph
to get just the observations who's property quality is "research" and the users who made and reviewed them.
See LinkChartLayer.initializationInclusionModeDefinition for more on inclusion lists.
//Define an inclusion list that limits the layer to the results returned from the query. An inclusion definition is an optional configuration property
// that initializes the layer with an explicitly defined subset of records.
let members = new Map();
let memberslist = new Map();
for (const result of results.resultRows) {
//for each result, add the returned record ids to a map by their entity type or relationship type
for (const index in result) {
const record = result[index];
if (!memberslist.has(record.typeName)) {
memberslist.set(record.typeName, { useAllData: false, members: new Map() });
}
memberslist.get(record.typeName).members.set(record.id, { id: record.id });
}
}
//only create a sublayer for the specified named types.
const inclusionDef = {
//only generate sublayer for the entity types and relationship types of records returned in the query
generateAllSublayers: false,
namedTypeDefinitions: memberslist
};
//create the layer
//the initializationInclusionModeDefinition is an optional property for layer construction. If not defined, all records in the graph will be included and
//and InclusionModeDefinition will be created for the entire graph at the time of creation.
const lcLayer = new KnowledgeGraphLayer({
url: url,
initializationInclusionModeDefinition: inclusionDef //optional
});Link chart layers are generated with default symbology and labels. You can optionally enable popups and or apply specific configurations to individual sublayers once the layer is loaded.
//Once the layer has loaded, you can enable popups or change the configuration of a specific sublayer.
//This is optional
await lcLayer.load()
lcLayer.layers.forEach((sublayer) => {
sublayer.popupTemplate = sublayer.createPopupTemplate();
});
map.add(lcLayer);