require(["esri/widgets/ElevationProfile/ElevationProfileLineInput"], (ElevationProfileLineInput) => { /* code goes here */ });
import ElevationProfileLineInput from "@arcgis/core/widgets/ElevationProfile/ElevationProfileLineInput.js";
esri/widgets/ElevationProfile/ElevationProfileLineInput
Profile line which samples elevation from the geometry of the input Graphic itself, typically used on input lines with z values. If the input graphic is draped (elevation mode is "on-the-ground"), the elevation is sampled from the Ground, in case the scene has ground layers.
In 2D z values are not fetched from feature based layers. Therefore, a profile is generated for ElevationProfileLineInput only when the input feature is a client-side graphic with z values in a MapView.
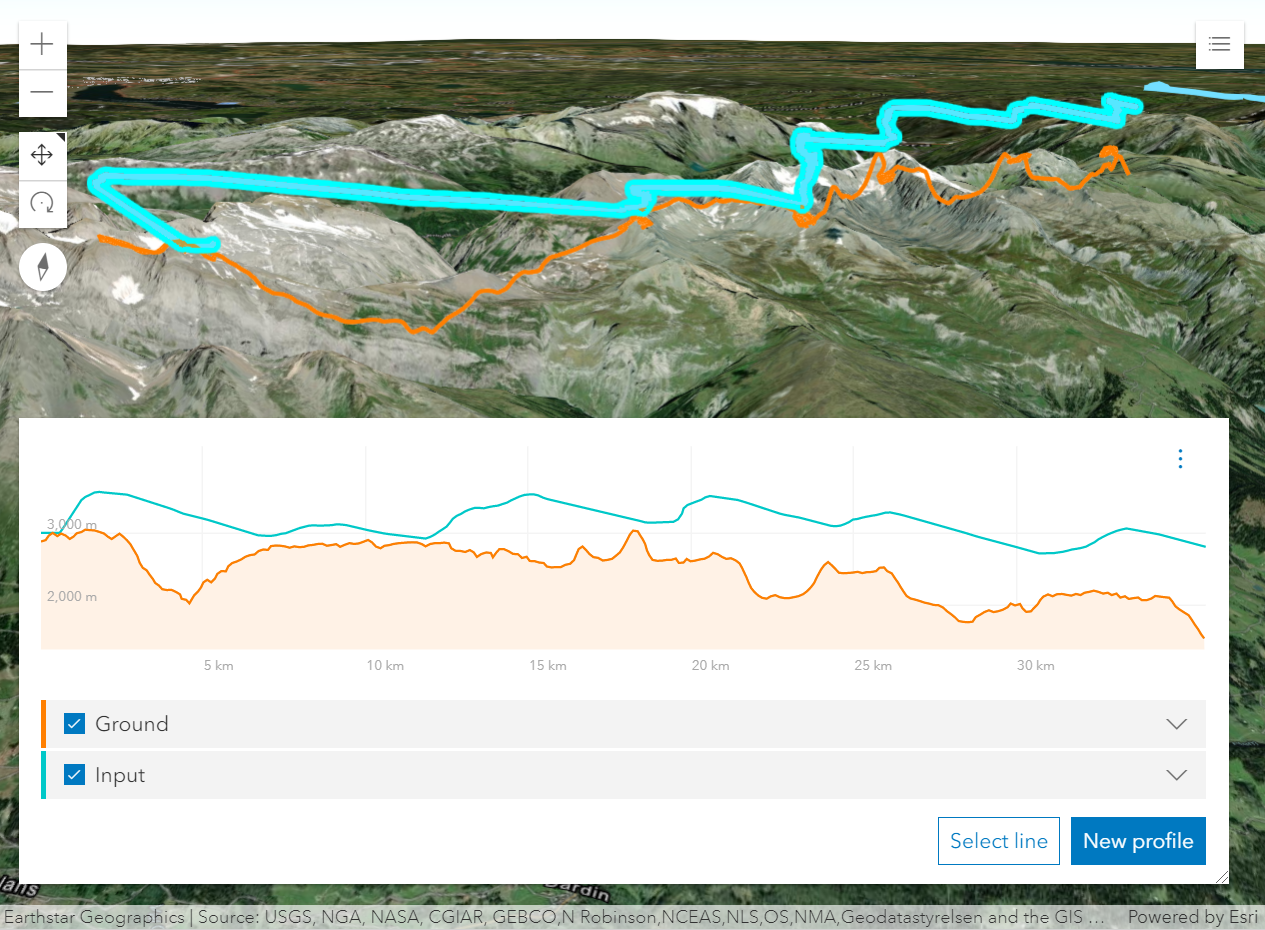
 Profile generated from a line feature with z-values. The orange profile is created with a profile line of type input.
- See also
const elevationProfile = new ElevationProfile({
  view: view,
  profiles: [{
    type: "input",
    color: "orange"
  }, {
    type: "ground",
    color: "lime"
  }]
});
Property Overview
| Name | Type | Summary | Class |
|---|---|---|---|
Color of the line on the chart and in the view. | ElevationProfileLineInput | ||
The name of the class. | Accessor | ||
Point being hovered in the chart, in the view's spatial reference. | ElevationProfileLine | ||
Unique identifier for the profile line. | ElevationProfileLine | ||
How far along the generation of this profile is. | ElevationProfileLine | ||
List of samples that make up the elevation profile. | ElevationProfileLine | ||
Statistics about the generated elevation profile, if available. | ElevationProfileLine | ||
Title of the line, to be displayed in the chart tooltip and in the chart legend. | ElevationProfileLine | ||
The line type. | ElevationProfileLineInput | ||
Whether a line visualization representing elevationSamples should be added to the SceneView. | ElevationProfileLineInput | ||
Whether the line should be computed and shown in the chart. | ElevationProfileLine |
Property Details
-
Color of the line on the chart and in the view.
- Default Value:"#00c8c8"
-
Inherited from ElevationProfileLine
-
Point being hovered in the chart, in the view's spatial reference.
-
id
InheritedPropertyid StringInherited from ElevationProfileLine -
Unique identifier for the profile line.
-
progress
InheritedPropertyprogress NumberreadonlyInherited from ElevationProfileLine -
How far along the generation of this profile is. 0 means nothing was loaded and 1 means loading is complete.
-
samples
InheritedPropertysamples ElevationProfileSample[] |null |undefinedreadonlyInherited from ElevationProfileLine -
List of samples that make up the elevation profile. It can be passed to a graphing library in order to display the profile in 2D.
-
statistics
InheritedPropertystatistics ElevationProfileStatistics |null |undefinedreadonlyInherited from ElevationProfileLine -
Statistics about the generated elevation profile, if available.
For slope computations, profiles are sampled at a minimum distance of 10 meters (32.8 feet). Higher resolution profiles are downsampled to a 10-meter (32.8-foot) sampling distance before calculating the slope.
-
Inherited from ElevationProfileLine
-
Title of the line, to be displayed in the chart tooltip and in the chart legend.
-
type
Propertytype Stringreadonly -
The line type.
For ElevationProfileLineInput the type is always "input".
-
viewVisualizationEnabled
PropertyviewVisualizationEnabled BooleanSince: ArcGIS Maps SDK for JavaScript 4.20ElevationProfileLineInput since 4.18, viewVisualizationEnabled added at 4.20. -
Whether a line visualization representing elevationSamples should be added to the SceneView. This property doesn't apply to MapView.
- Default Value:false
-
visible
InheritedPropertyvisible BooleanInherited from ElevationProfileLine -
Whether the line should be computed and shown in the chart.
- Default Value:true
Method Overview
| Name | Return Type | Summary | Class |
|---|---|---|---|
Adds one or more handles which are to be tied to the lifecycle of the object. | Accessor | ||
Returns true if a named group of handles exist. | Accessor | ||
Removes a group of handles owned by the object. | Accessor |
Method Details
-
Inherited from Accessor
Since: ArcGIS Maps SDK for JavaScript 4.25Accessor since 4.0, addHandles added at 4.25. -
Adds one or more handles which are to be tied to the lifecycle of the object. The handles will be removed when the object is destroyed.
// Manually manage handles const handle = reactiveUtils.when( () => !view.updating, () => { wkidSelect.disabled = false; }, { once: true } ); this.addHandles(handle); // Destroy the object this.destroy();ParametershandleOrHandles WatchHandle|WatchHandle[]Handles marked for removal once the object is destroyed.
groupKey *optionalKey identifying the group to which the handles should be added. All the handles in the group can later be removed with Accessor.removeHandles(). If no key is provided the handles are added to a default group.
-
hasHandles
InheritedMethodhasHandles(groupKey){Boolean}Inherited from AccessorSince: ArcGIS Maps SDK for JavaScript 4.25Accessor since 4.0, hasHandles added at 4.25. -
Returns true if a named group of handles exist.
ParametergroupKey *optionalA group key.
ReturnsType Description Boolean Returns trueif a named group of handles exist.Example// Remove a named group of handles if they exist. if (obj.hasHandles("watch-view-updates")) { obj.removeHandles("watch-view-updates"); }
-
Inherited from Accessor
Since: ArcGIS Maps SDK for JavaScript 4.25Accessor since 4.0, removeHandles added at 4.25. -
Removes a group of handles owned by the object.
ParametergroupKey *optionalA group key or an array or collection of group keys to remove.
Exampleobj.removeHandles(); // removes handles from default group obj.removeHandles("handle-group"); obj.removeHandles("other-handle-group");