require(["esri/renderers/FlowRenderer"], (FlowRenderer) => { /* code goes here */ });
import FlowRenderer from "@arcgis/core/renderers/FlowRenderer.js";
esri/renderers/FlowRenderer
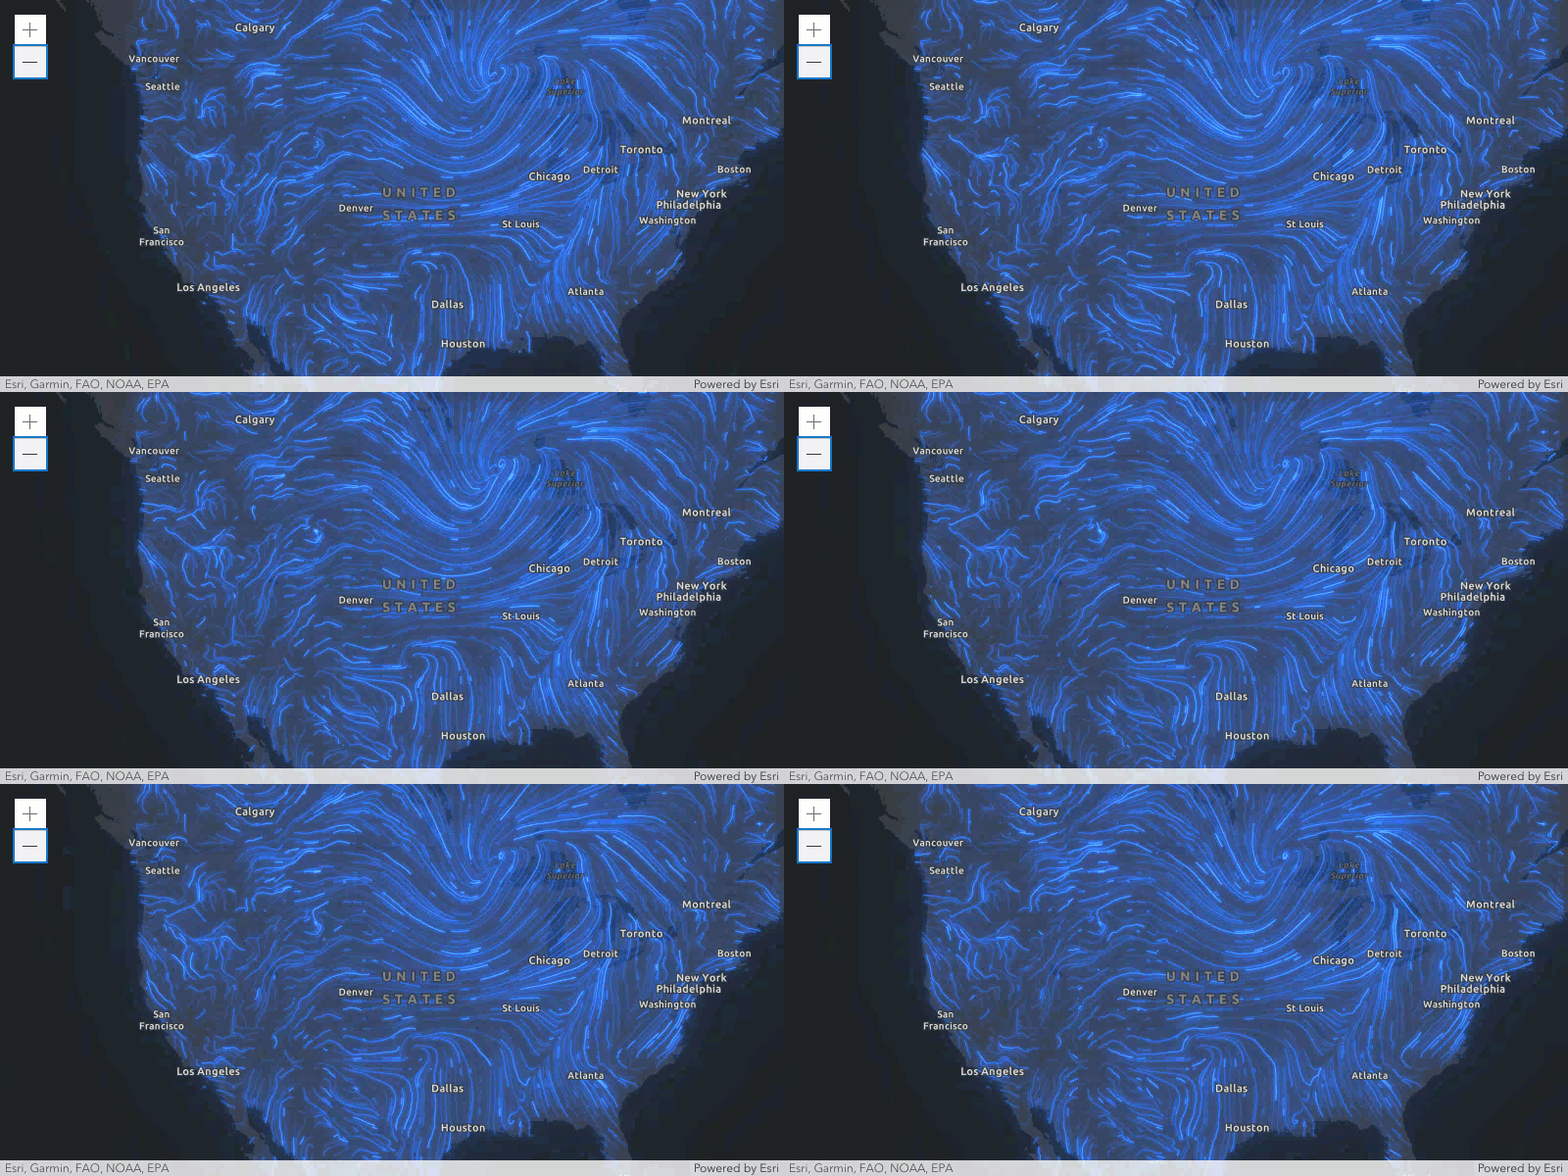
The FlowRenderer allows you to visualize your raster data with animated streamlines. This renderer can be used to visualize flow direction and magnitude information for meteorology and oceanography raster data.
To use this renderer, the source type of your raster dataset must be Vector-UV or Vector-MagDir.
The direction of the raster defines the direction of movement, and the magnitude defines the visible length of the streamline.
Known Limitations
- The FlowRenderer is only supported with ImageryTileLayer and ImageryLayer.
- The FlowRenderer is only supported in 2D MapView.
const renderer = new FlowRenderer({
  density: 1, // visualization will have the maximum amount of streamlines
  color: [50, 120, 240], // blue
  flowSpeed: 10,
  trailWidth: "2px"
});
Constructors
-
Parameterproperties Objectoptional
See the properties for a list of all the properties that may be passed into the constructor.
Examplelet renderer = { type: "flow", color: [50, 120, 240, 1] }
Property Overview
| Name | Type | Summary | Class |
|---|---|---|---|
Contains metadata about renderers generated from the flowRendererCreator.createRenderer() method, including information for setting UI elements such as sliders and themes. | FlowRenderer | ||
The color of the animated streamlines. | FlowRenderer | ||
The name of the class. | Accessor | ||
The density of the streamlines. | FlowRenderer | ||
Defines the flow direction of the data. | FlowRenderer | ||
The speed of the animated streamlines, relative to the simulation time. | FlowRenderer | ||
An object providing options for displaying the renderer in the Legend. | FlowRenderer | ||
The maximum path length streamlines will travel in points. | FlowRenderer | ||
The front cap of the streamline. | FlowRenderer | ||
The approximate visible length of the streamline in points. | FlowRenderer | ||
The width of the streamline trail in points. | FlowRenderer | ||
The type of Renderer. | FlowRenderer | ||
An array of VisualVariable objects. | FlowRenderer |
Property Details
-
authoringInfo
PropertyauthoringInfo AuthoringInfoautocast -
Contains metadata about renderers generated from the flowRendererCreator.createRenderer() method, including information for setting UI elements such as sliders and themes. This allows the authoring clients to save specific overridable settings so user selections can be remembered the next time they are accessed via the UI.
-
color
Propertycolor Color -
The color of the animated streamlines.
- Default Value:[255, 255, 255, 1]
-
density
Propertydensity Number -
The density of the streamlines. This will determine how many lines appear in the visualization. Accepted values are between
0and1. A value of0means no lines will be rendered. A value of1will render the maximum number of lines.density = 0.1density = 0.5density = 1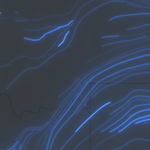


- Default Value:0.8
-
flowRepresentation
PropertyflowRepresentation String -
Defines the flow direction of the data. This can be modified to display meteorological (the direction it is flowing from) or climatological data (the direction it is flowing to).
Value Description Example flow-from Flow from angle. 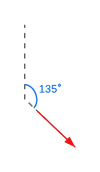
flow-to Flow to angle. 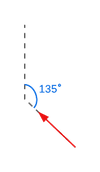
Possible Values:"flow-from" |"flow-to"
- Default Value:"flow-from"
-
flowSpeed
PropertyflowSpeed Number -
The speed of the animated streamlines, relative to the simulation time. This serves as a multiple of the magnitude from the raster layer. For instance, if the magnitude is 2ms, and the
flowSpeedis 10, then the actual speed of the streamline will be 20 pts/s. A speed of 0 will result in no animation.- Default Value:10
-
An object providing options for displaying the renderer in the Legend.
Examplerenderer.legendOptions = { title: "Wind speed" };
-
The maximum path length streamlines will travel in points. Only a portion of the streamline will be visible at a time depending on the magnitude or UV coming from the raster layer and the defined trailLength. During the course of the animation, the visible streamline will travel to reach the path length defined here, then will restart. This value may be autocast with a string expressing size in points or pixels (e.g.
100px).- Default Value:200
Examples// width in points flowRenderer.maxPathLength = 100;// width in pixels flowRenderer.maxPathLength = "200px";// width in points flowRenderer.maxPathLength = "100pt";
-
trailCap
PropertytrailCap StringSince: ArcGIS Maps SDK for JavaScript 4.24FlowRenderer since 4.23, trailCap added at 4.24. -
The front cap of the streamline. A round cap will only be applied if trailWidth is greater than
4pxor3pt.Possible Values:"butt" |"round"
- Default Value:"butt"
-
trailLength
PropertytrailLength Number -
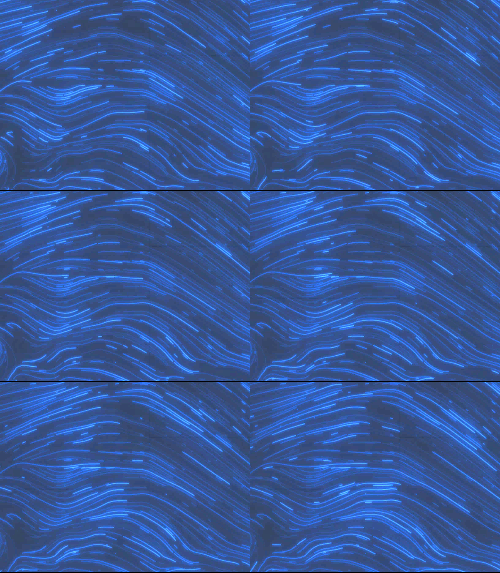
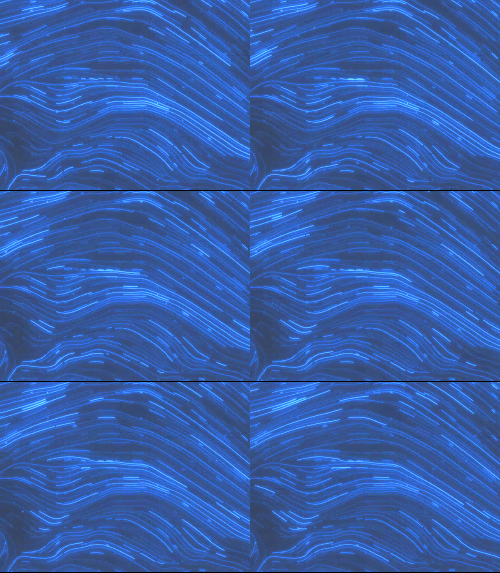
The approximate visible length of the streamline in points. The streamlines will appear shorter when the trailLength is a smaller number, since they will start to fade before they reach the full maxPathLength.
trailLength = 20trailLength = 100trailLength = 250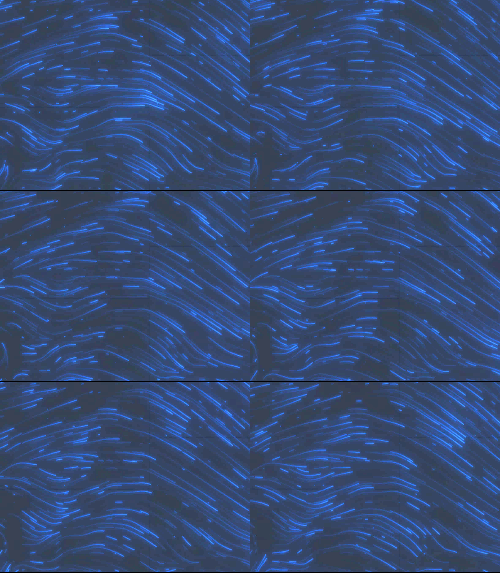
- Default Value:100
-
The width of the streamline trail in points. This value may be autocast with a string expressing size in points or pixels (e.g.
3px).- Default Value:1.5
Examples// width in points flowRenderer.trailWidth = 4;// width in pixels flowRenderer.trailWidth = "2px";// width in points flowRenderer.trailWidth = "4pt";
-
type
Propertytype Stringreadonly -
The type of Renderer.
For FlowRenderer the type is always "flow".
-
visualVariables
PropertyvisualVariables VisualVariable[] |nullautocast -
An array of VisualVariable objects. Each object must indicate the type of visual variable to apply (e.g. ColorVisualVariable), the numeric field from which to drive the visualization, and the visual values to map to the data. The following list identifies each visual variable type that is supported with the
FlowRendererand provides a link to the specification table of each: ColorVisualVariable, OpacityVisualVariable, and SizeVisualVariable.SizeVisualVariablewill update the trailWidth property.When setting fields for the visual variables set on the FlowRenderer, use the
Magnitudefield.Magnitudewill return pixel values from the first band. If the data represents u (zonal) and v (meridional) speed components, values are automatically converted toMagnitudeandDirection.- See also
Exampleconst renderer = new FlowRenderer({ visualVariables: [{ type: "color", field: "Magnitude", stops: [ { value: 3, color: "#0080ff" }, { value: 15, color: "#00ff00" } ] }, { type: "opacity", field: "Magnitude", stops: [ { value: 1, opacity: 0.5 }, { value: 8, opacity: 1 } ] }] });
Method Overview
| Name | Return Type | Summary | Class |
|---|---|---|---|
Adds one or more handles which are to be tied to the lifecycle of the object. | Accessor | ||
Creates a deep clone of the renderer. | FlowRenderer | ||
* | Creates a new instance of this class and initializes it with values from a JSON object generated from an ArcGIS product. | FlowRenderer | |
Returns true if a named group of handles exist. | Accessor | ||
Removes a group of handles owned by the object. | Accessor | ||
Converts an instance of this class to its ArcGIS portal JSON representation. | FlowRenderer |
Method Details
-
Inherited from Accessor
Since: ArcGIS Maps SDK for JavaScript 4.25Accessor since 4.0, addHandles added at 4.25. -
Adds one or more handles which are to be tied to the lifecycle of the object. The handles will be removed when the object is destroyed.
// Manually manage handles const handle = reactiveUtils.when( () => !view.updating, () => { wkidSelect.disabled = false; }, { once: true } ); this.addHandles(handle); // Destroy the object this.destroy();ParametershandleOrHandles WatchHandle|WatchHandle[]Handles marked for removal once the object is destroyed.
groupKey *optionalKey identifying the group to which the handles should be added. All the handles in the group can later be removed with Accessor.removeHandles(). If no key is provided the handles are added to a default group.
-
clone
Methodclone(){FlowRenderer} -
Creates a deep clone of the renderer.
ReturnsType Description FlowRenderer Example// Creates a deep clone of the first layer's renderer let renderer = view.map.layers.at(0).renderer.clone();
-
Creates a new instance of this class and initializes it with values from a JSON object generated from an ArcGIS product. The object passed into the input
jsonparameter often comes from a response to a query operation in the REST API or a toJSON() method from another ArcGIS product. See the Using fromJSON() topic in the Guide for details and examples of when and how to use this function.Parameterjson ObjectA JSON representation of the instance in the ArcGIS format. See the ArcGIS REST API documentation for examples of the structure of various input JSON objects.
ReturnsType Description * Returns a new instance of this class.
-
hasHandles
InheritedMethodhasHandles(groupKey){Boolean}Inherited from AccessorSince: ArcGIS Maps SDK for JavaScript 4.25Accessor since 4.0, hasHandles added at 4.25. -
Returns true if a named group of handles exist.
ParametergroupKey *optionalA group key.
ReturnsType Description Boolean Returns trueif a named group of handles exist.Example// Remove a named group of handles if they exist. if (obj.hasHandles("watch-view-updates")) { obj.removeHandles("watch-view-updates"); }
-
Inherited from Accessor
Since: ArcGIS Maps SDK for JavaScript 4.25Accessor since 4.0, removeHandles added at 4.25. -
Removes a group of handles owned by the object.
ParametergroupKey *optionalA group key or an array or collection of group keys to remove.
Exampleobj.removeHandles(); // removes handles from default group obj.removeHandles("handle-group"); obj.removeHandles("other-handle-group");
-
toJSON
MethodtoJSON(){Object} -
Converts an instance of this class to its ArcGIS portal JSON representation. See the Using fromJSON() guide topic for more information.
ReturnsType Description Object The ArcGIS portal JSON representation of an instance of this class.
