 Hide Table of Contents
 Tutorials
 About the API
 Work with the API
 Graphics and feature layers
 Popups and Info Windows
 Mobile
 ArcGIS Server Services
 References
 What's New archive
Arcade integration for visualization and labeling
Arcade is a lightweight expression language designed for creating custom content, visualizations, and labels across the ArcGIS platform. In the 3.19 release of the API, Arcade may be used for creating custom data-driven visualizations and labeling. Field values are treated as global variables in Arcade expressions and may be accessed using the following syntax: $feature.FIELD_NAME. Arcade comes equipped with its own library of functions that allow users to do simple math calculations and text formatting.
Rather than drive visualizations based on the value of a layer's field, users now can pass an expression to renderers and visual variables. The expression will execute for each feature, generating a symbol based on the returned value. This is convenient when a service doesn't have the exact values you need. To leverage Arcade in renderers, you must pass it as a string to the valueExpression property of the renderer or visual variable.

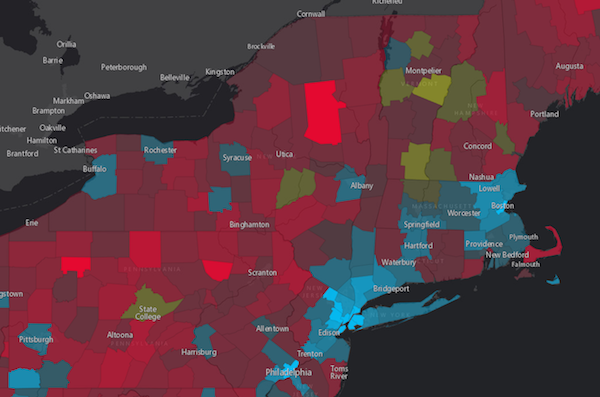
The following snippet demonstrates how you can write an Arcade expression showing the share of the vote earned in an election by the winner for each geography in the layer.
  // CANDIDATE1 and CANDIDATE2 are field values
  var arcade = "var votes = [$feature.CANDIDATE1, $feature.CANDIDATE2];"
    // Sum() and Max() are built-in Arcade functions
    + "return ( Max(votes) / Sum(votes) ) * 100;";

  renderer.setVisualVariables([{
    type: "colorInfo",
    valueExpression: arcade,  // valueExpression points to the Arcade expression
    valueExpressionTitle: "Share of winner's votes",
    stops: [ ... ]
  }]);
The Create a custom visualization using Arcade sample demonstrates how Arcade can be used in the data visualization context.
LabelingArcade may also be used to label features in a FeatureLayer. This is handled in the expression property of the labelExpressionInfo object of the LabelClass. As of 3.19, the value property of labelExpressionInfo is deprecated and Arcade expressions should be used instead.

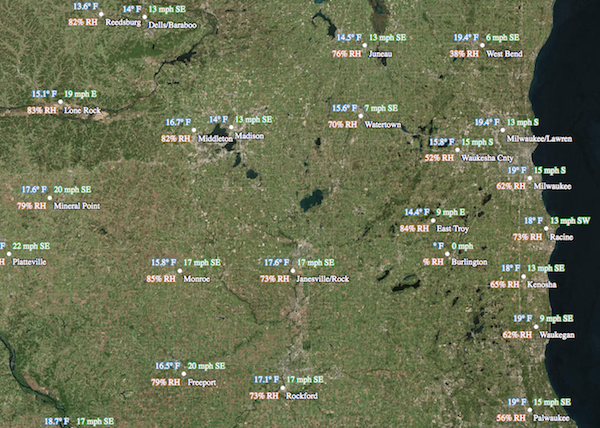
The snippet below demonstrates how to label features with only the value of a field in the layer. Remember to use the expression property of the labelExpressionInfo object; the value property will not understand the Arcade expression.
  // returns the value of a field in the layer
  // the value of this field will be the label for each feature
  var arcade = "$feature.STATION_NAME";

  // set the arcade expression to the `expression` property of labelExpressionInfo
  var labelClass = new LabelClass({
    labelExpressionInfo: {
      expression: arcade
    },
    labelPlacement: "below-right",
    minScale: 2500000
  });
  nameClass.symbol = new TextSymbol();

  // set the label class to the feature layer
  featureLayer.setLabelingInfo([ labelClass ]);
Take a look at the Label features using Arcade expressions sample to see examples of various Arcade expressions used in the labeling context.
Arcade is convenient for a number of reasons, including providing the ability to save expressions to layer items and web maps in ArcGIS Online or Portal for ArcGIS. That means expressions can be authored in apps and persisted in webmaps throughout the ArcGIS platform.
Be sure to read the full Arcade documentation for details about its syntax and the Arcade guide page for more examples of its usage within the API.
New locales
Version 3.19 adds support for Indonesian (id) and Bosnian (bs) locales. See Localization topic for more information about using different locales.
VectorTileLayer Update
This release of the JavaScript API includes support for vector tiles in any ArcGIS-supported spatial references. Users can build VectorTileLayer packages in any ArcGIS-supported spatial reference. These packages can then be published to Portal for ArcGIS or ArcGIS Online as vector tile layers. Users then can bring these layers into their web apps.
Breaking changes
- To increase security, browsers are starting to block Geolocation API on insecure pages, meaning that the LocateButton will not work from non-secure web pages (i.e., hosted on http). Google Chrome first implemented this in version 50 (April 2016) and Apple in Safari 10 (September 2016). Mozilla/Firefox is planning to do the same. At version 3.17 and 4.0 the JSAPI no longer displayed the Locate Button for non-secure web apps in the Chrome browser. As of version 3.19 and 4.2, the JSAPI no longer displays the Locate Button for non-secure web apps in any web browser. Note that localhost is considered "potentially secure" and can be used for easy testing in browser that supports isSecureContext (currently Chrome and Firefox).
API updates and enhancements
- New properties
legendOptions,valueExpression,valueExpressionTitleon classClassBreaksRenderer - New properties
legendOptions,valueExpression,valueExpressionTitleon classUniqueValueRenderer - New properties
legendOptions,valueExpression,valueExpressionTitlein each of the visual variables:colorInfo,sizeInfo, andopacityInfo. - The
expressionproperty of thesizeInfovisual variable was deprecated in 3.19. If creating a visualization where marker and outline sizes are driven by the map scale, then pass the$view.scaleexpression to thevalueExpressionproperty of the object. - New property
valueExpressioninrotationInfo. - New parameter options
valueExpression,sqlExpression, andsqlWhereinsmartMappingandFeatureLayerStatisticsfunctions. - Updated list of supported browser to state "IE9+" instead of "IE7".
Bug fixes
- BUG-000095901: The basemap gallery now switches to HTTPS when using the US Geological Survey (USGS) national basemap.
- BUG-000099832: Fixed an issue where adding two instances of the ArcGISImageServiceLayer class produced console errors.
- BUG-000099978: Image pop-ups no longer display if they are not visible at the current map scale.
- BUG-000095191: Existing default values in a feature service are no longer lost if a new field is added.
- BUG-000095212: Fixed an issue where certain geometries did not project on-the-fly correctly.
- BUG-000091984: Cross and X symbols now display properly.
- GLOBAL-017832: The Color Ramp drop down list is cut off on Image Display page.
- For popups specified using a custom attribute display like
"description": "{Raster.ServicePixelValue.Raw}% of this area is covered by trees."and the value is an array, the API no longer adds an extra space.
Additional packages
Version 3.19 of the ArcGIS API for JavaScript include:
- dgrid versions
- dgrid version 1.1.0 (since version 3.17)
- dgrid version 0.3.17 (since version 3.13)
NOTE: If working with version 1.1.0, please reference the
dgrid1directory, whereas version 0.3.17 should reference thedgriddirectory. Please refer to the dgrid 0.4 Migration Guide for additional information on migrating to the newer version.
- Dojo version 1.11.2 (since version 3.18)
- dstore version 1.1.1 (since version 3.16)
- put-selector version 0.3.6 (since version 3.13)
- xstyle version 0.3.2 (updated for version 3.17)
Additional Resources on GitHub
Use the repository on GitHub for the JS API TypeScript definitions.