 Hide Table of Contents
 Tutorials
 About the API
 Work with the API
 Graphics and feature layers
 Popups and Info Windows
 Mobile
 ArcGIS Server Services
 References
 What's New archive
The InfoTemplate class is used to define the content and title for an info window. If you are using version 2.2 or greater, you can define the content and title using either a string or function. Prior to version 2.2, you can only use a string.
Resizing
By default, the content area for an info window is 250 pixels wide and 100 pixels high. If the content you want to display is larger than this size it will scroll. To resize the info window, use the resize method to specify the new width and height.
map.infoWindow.resize(300, 200);
Using Strings
To format content using a string, you will create a string value that defines the content to display. The string can include HTML markup, attribute placeholders and formatting functions. Let's look at a few examples of ways you can format content using a string:
- Concatenate strings
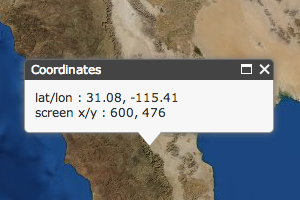
map.infoWindow.setTitle("Coordinates"); map.infoWindow.setContent("lat/lon : " + latitude.toFixed(2) + ", " + longitude.toFixed(2)); - Use HTML
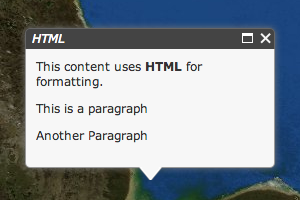
map.infoWindow.setTitle("HTML"); map.infoWindow.setContent("This content uses <strong>HTML</strong> for formatting.<p>This is a paragraph</p><p>Another Paragraph</p>"); - Placeholders (string substitution)
When graphics or feature layers have an info template, that info template is automatically used by the API to construct info window content when a feature is selected. Within an info template, placeholders denoted by
${}are used to specify attributes to display. At run-time, substitution occurs and the placeholder is replaced with the actual attribute value for the selected feature. In the code below, values inside${}correspond to attribute field names. In the screen shot, values for the selected feature were substituted for the associated placeholders.var content = "<b>Status</b>: ${STATUS}" + "<br><b>Cummulative Gas</b>: ${CUMM_GAS} MCF" + "<br><b>Total Acres</b>: ${APPROXACRE}" + "<br><b>Avg. Field Depth</b>: ${AVG_DEPTH} meters"; var infoTemplate = new InfoTemplate("${FIELD_NAME}", content);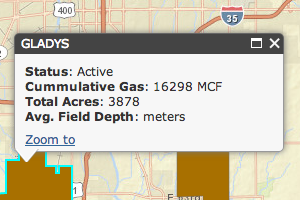
Formatting date, time and number values
Use one of the out of the box formatters to format date and time values. This feature was added with the 2.2 release of the API. The syntax for using an out of the box formatting function is:
${FIELD_NAME:FORMAT_FUNCTION_NAME(OPTION_A: value, OPTION_B: value)}
The format dates in an info window sample has examples of how to use the various formatting functions described below.
- DateString
Formats the date into a human readable format. Supports the following options:
Name Value hideTime Hide the time component of the date string. The default value is false. local Display time in the local time zone. The default value is false. When false the date will display in UTC. systemLocale Display time in the system locale (local time zone). The default value is false. Pattern Example ${EVENT_DATE:DateString} Thu, 15 May 1986 04:26:32 GMT ${EVENT_DATE:DateString(local: true, hideTime: true)} Fri May 07 2004 - DateFormat
Converts date fields into a human readable format using the dojo/data/locale.format method. Supports the same set of options as dojo/date/locale.format.
Pattern Example ${EVENT_DATE:DateFormat} 3/8/08 4:00 PM ${EVENT_DATE:DateFormat(selector: 'date', fullYear: true)} 4/8/2009 ${EVENT_DATE:DateFormat(datePattern: 'h \\'o\\'\\'clock\\' a, zzzz', selector: 'date')} 4 o'clock PM, Pacific Standard Time - NumberFormat
Formats numbers into various formats using the dojo/number.format method. Supports the same set of options as dojo/number.format.
Pattern Example ${Magnitude:NumberFormat} 4.237854 ${Magnitude:NumberFormat(places:2)} 4.20
Using custom functions
Sometimes you want to display more than text in an info window. You might want to display a chart, categorize information into tabs or use a Dojo widget in an info window. In such cases, you can write a function that returns either a string, a reference to an HTML element or a deferred object. When a graphic is clicked, the function is executed and the return value displays in the info window. The function is passed a reference to the current graphic as an argument, which provides access to the graphic's attribute information. Note that custom formatting functions are required to be globally accessible.
- Return a string
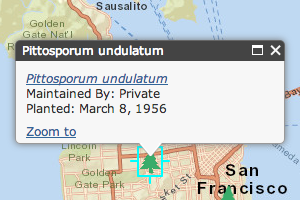
Using a custom function bypasses the info window and info template's default string substitution so strings returned from a custom function should not include placeholders. To use feature attributes, access them directly in your custom function. The example below uses the value of a graphic's qSpecies attribute to build a URL.
var template = new InfoTemplate();
template.setContent(getTextContent);

function getTextContent(graphic) {
  var attr = graphic.attributes.qSpecies.replace('"', "").split("::");
  var commonName = string.trim((attr[1] === "") ? attr[0] : attr[1]);
  var scientificName = string.substitute("${0}_${1}", attr[0].split(" "));
  var plantDate = locale.format(new Date(graphic.attributes.PlantDate), {
    selector: 'date',
    datePattern: 'MMMM d, y'
  });
  return "<a href=https://en.wikipedia.org/wiki/" +
    scientificName + "><i>" + string.substitute("${0} ${1}", attr[0].split(" ")) +
    "</i></a><br>Maintained By: " + graphic.attributes.qCaretaker +
    "<br>Planted: " + plantDate;
}
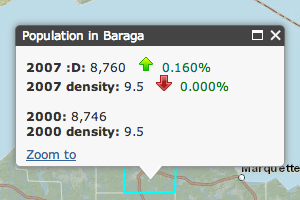
It is also possible to use a function on a per attribute basis. The example below calculates percent change and displays an up or down arrow according to a positive or negative change.
var infoTemplate = new InfoTemplate(); infoTemplate.setTitle("Population in ${NAME}"); infoTemplate.setContent("<b>2007 :D: </b>${POP2007:compare}<br/>" + "<b>2007 density: </b>${POP07_SQMI:compare}<br/><br/>" + "<b>2000: </b>${POP2000:NumberFormat}<br/>" + "<b>2000 density: </b>${POP00_SQMI:NumberFormat}"); compare = function (value, key, data) { var result = "", diff, pctChange; switch (key) { case "POP2007": result = value > data.POP2000 ? "images/up.png" : "images/down.png"; diff = data.POP2007 - data.POP2000; pctChange = (diff * 100) / data.POP2000; break; case "POP07_SQMI": result = value > data.POP00_SQMI ? "images/up.png" : "images/down.png"; diff = data.POP07_SQMI - data.POP00_SQMI; pctChange = (diff * 100) / data.POP00_SQMI; break; } return number.format(value) + " <img src='" + result + "'>" + " <span style='color: " + (pctChange < 0 ? "red" : "green") + ";'>" + number.format(pctChange, { places: 3 }) + "%</span>"; }; - Reference to an HTML element
Return a reference to an HTML element by programatically creating an HTML element using either dojo/dom-construct.create or create a Dojo dijit and return the dijit's dom node.
dojo/dom-construct.create wraps the browser's native
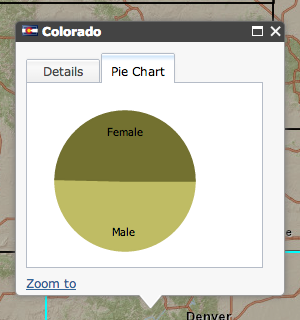
document.createElementandappendChildmethods and normalizes differences across browsers. Example of using dom-construct.create to create an element:require(["dojo/dom-construct"], function(domConstruct){ var node = domConstruct.create("div", { innerHTML: "Text Element inside an HTML div element." }); });Another option is to create a dijit and return its dom node. This is shown in the screen shot above of the info window with chart sample, which creates multiple layout dijits and uses them as the content for the info window. The key point to note is that the formatting function returns the dijit's domNode rather than the dijit itself.
var tc = new TabContainer({ style: "width:100%;height:100%;" }, domConstruct.create("div")); return tc.domNode; - Deferred Object
In some cases, the content you want to display is not immediately available. It may be content that you need to download from a server using
esri/request, which returns an instance of dojo/Deferred. When a feature is clicked, a deferred is returned by a custom function. Once the deferred is resolved, the info window will update accordingly.When using version 3.4 or later of the API, this workflow is not supported since an
esri/dijit/Popupinstance is the default infoWindow of the map. To use a deferred with the infoWindow content you must either use an instance ofesri/dijit/InfoWindowas the map's infoWindow or listen for a map click event, initiate an async operation, and then callPopup.setContent()andPopup.setTitle()when the async operation is completed.When a polyline on the map is clicked, it is sent as input to a Server Object Extension (SOE) that generates an elevation profile. Once the profile is available it is displayed in the info window.
function getTextContent(graphic) {
  var geometry = webMercatorUtils.webMercatorToGeographic(graphic.geometry);
  soeParams.InputPolyline = JSON.stringify(geometry.toJson());
  var def =  esriRequest({
    url: soeURL,
    content: soeParams,
    callbackParamName: "callback",
    load: function(fset) {
      return "<img src='" + fset.profileImageUrl + "'/>";
    }
  });
  return def;
}

