 Hide Table of Contents
 Analysis
 Dynamic Layers
 Editing
 Feature Layers
 Feature Table
 Graphics
 Map
Map
 Mobile
 Online and Portal
 Popups and Info Windows
 Query and Select
 Renderers, Symbols, Visualization
 Search

Analysis - Find hot spots
Explore in the sandbox
Open in CodePen
View live sample
Description
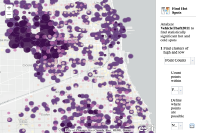
The Find Hot Spots tool will determine if there is any statistically significant clustering in the spatial pattern of your data.- Are your points (crime incidents, trees, traffic accidents) really clustered? How can you be sure?
- Have you truly discovered a statistically significant hot spot (for spending, infant mortality, consistently high test scores) or would your map tell a different story if you changed the way it was symbolized?
The Find Hot Spots tool will help you answer these questions with confidence.
Analysis is a subscription based service available through ArcGIS Online. Log-in credentials are always required when executing an Analysis task. Please supply your own credentials to use this sample.
Code
<!DOCTYPE html>
<html>
<head>
<meta http-equiv="Content-Type" content="text/html; charset=utf-8">
<meta name="viewport" content="initial-scale=1, maximum-scale=1,user-scalable=no">
<title>Hotspot Analysis</title>
<link rel="stylesheet" href="https://js.arcgis.com/3.46/dijit/themes/claro/claro.css" />
<link rel="stylesheet" href="https://js.arcgis.com/3.46/esri/css/esri.css" />

<style>
html, body {
    height:100%;
    width:100%;
    margin:0;
    padding:0;
}

#mapDiv {
    padding:0;
}
/* Don't display the analysis widget's close icon*/
.esriAnalysis .esriAnalysisCloseIcon {
    display:none;
}

#legendContainer{
    position: absolute;
    bottom: 8px;
    left:10px;
    z-index: 33;
    background-color: #fff;
    border-radius: 4px;
    border: solid 2px #ccc;
    display:none;
    width: 300px;
}

#rightPanel{
    border-left: solid 2px #ccc;
}
#analysisInfo{
    padding: 4px;
}
#loader{
    position: absolute;
    display:none;
    top:50%;
    left:50%;
    z-index: 99;
}
</style>

<script src="https://js.arcgis.com/3.46/"></script>
<script>
require([
    "dojo/ready",
    "dojo/on",
    "dojo/_base/array",
    "dojo/dom",
    "dijit/registry",
    "dojo/dom-style",
    "dojo/parser",
    "dijit/layout/BorderContainer",
    "dijit/layout/ContentPane",
    "esri/map",
    "esri/urlUtils",
    "esri/config",
    "esri/domUtils",
    "esri/request",
    "esri/layers/FeatureLayer",
    "esri/InfoTemplate",
    "esri/arcgis/Portal",
    "esri/dijit/analysis/FindHotSpots",
    "esri/dijit/Legend"
], function(
    ready,
    on,
    array,
    dom,
    registry,
    domStyle,
    parser,
    BorderContainer,
    ContentPane,
    Map,
    urlUtils,
    esriConfig,
    domUtils,
    esriRequest,
    FeatureLayer,
    InfoTemplate,
    arcgisPortal,
    FindHotSpots,
    Legend
) {
    ready(function(){
        parser.parse();
        //when close button is clicked for details panel show tool
        on(dom.byId("closeBtn"), "click", function(){
            domUtils.hide(dom.byId("infoPanel"));
            domUtils.show(dom.byId("toolPanel"));
        });

        var map = new Map("mapDiv",{
            basemap: "gray-vector",
            center: [-87.65, 41.85],
            zoom: 11
        });

        var crime = new FeatureLayer("https://services.arcgis.com/V6ZHFr6zdgNZuVG0/arcgis/rest/services/ChicagoCrime/FeatureServer/0",{
            id: "analysisLayer",
            name: "Vehicle Theft",
            outFields: ["ID","Beat","Ward","Year","Month","DOW","TheHour"]
        });
        var tracts = new FeatureLayer("https://services.arcgis.com/V6ZHFr6zdgNZuVG0/arcgis/rest/services/ChicagoCrime/FeatureServer/1",{
            name: "Tracts"
        });
        map.addLayers([crime,tracts]);

        //Add the legend widget. We'll use this to display the analysis results
        var legend = new Legend({
            map: map,
            layerInfos: []
        },"legend");
        legend.startup();

        map.on("layers-add-result", initializeHotSpotTool);

        function initializeHotSpotTool(){
            showToolPanel();

            //Define the default inputs for the Hot Spot widget
            var hotSpotParams = {
                id: "analysisTool",
                analysisLayer: crime,
                portalUrl: "https://www.arcgis.com",
                aggregationPolygonLayers: [tracts],
                boundingPolygonLayers: [tracts],
                showHelp: false,
                showSelectAnalysisLayer: false,
                showCredits: false,
                map: map,
                returnFeatureCollection: true
            };

            var hotSpots = new FindHotSpots(hotSpotParams, "hotSpotDiv");
            hotSpots.startup();

            //If any errors occur reset the widget (Not Working...troubleshoot)
            on(hotSpots, "job-fail", function(params){
                resetTool("error");
            });
            on(hotSpots, "job-status", function(status){
              if(status.jobStatus === 'esriJobFailed'){
              alert("Job Failed: " + status.messages[0].description);
                resetTool("error");
              }

            });
            on(hotSpots, "job-cancel", function(){
                resetTool("error");
            });
            on(hotSpots, "job-submit", function(result){
                //display the loading icon
                domUtils.show(dom.byId("loader"));
                resetTool("submit");

            });
            //The hot spots analysis has finished successfully - display the results
            on(hotSpots, "job-result", function(result){

                //hide the loading icon
                domUtils.hide(dom.byId("loader"));

                //add the results to the map and display the legend.
                if(result.value){
                    var template = new InfoTemplate("Results", "${*}");
                    var resultLayer = new FeatureLayer(result.value.url || result.value, {
                        infoTemplate: template,
                        outFields: ["*"],
                        opacity: 0.7, //default too transparent
                        id: "resultLayer"
                    });

                    map.addLayer(resultLayer);
                    //refresh and display the legend
                    domUtils.show(dom.byId("legendContainer"));
                    legend.refresh([{layer: resultLayer}]);
                }
                if(result.analysisReport){
                    //hide the hot spots panel and show the analysis info.
                    domUtils.hide(dom.byId("toolPanel"));
                    domUtils.show(dom.byId("infoPanel"));
                    dom.byId("analysisInfo").innerHTML = result.analysisReport;
                }

                //re-enable the hot spots tool
                hotSpots.set("disableRunAnalysis", false);

            });
        }

        function resetTool(status){
            if(status === "error"){
                var tool = registry.byId("analysisTool");
                tool.set("disableRunAnalysis", false);
            }
            //Analysis started lets clean up any old results
            //Hide the legend, remove the results layer
            var layer = map.getLayer("resultLayer");
            if(layer){
                map.removeLayer(layer);
            }
            domUtils.hide(dom.byId("legendContainer"));
        }
        function showToolPanel(){
          //expand the right panel to display the content
            var cp = registry.byId("rightPanel");
            domStyle.set(cp.domNode, {width: "20%"});
            registry.byId("mainWin").resize();

            map.reposition();
            map.resize();
        }
    });
});
</script>
</head>

<body class="claro">
<div id="mainWin"  data-dojo-type="dijit/layout/BorderContainer"  data-dojo-props="design:'headline',gutters:false"  style="width:100%; height:100%;">
    <div id="rightPanel" data-dojo-type="dijit/layout/ContentPane" data-dojo-props="region:'right'" >
        <div id="toolPanel">
            <div id="status"></div>
            <div id="hotSpotDiv"></div>
        </div>
        <div id="infoPanel" style="display:none;">
            <a id="closeBtn" title="Close" style="position:absolute;top:10px;right:5px;cursor:pointer;">
                <img border="0" src="https://js.arcgis.com/3.46/esri/dijit/analysis/images/close.gif">
            </a>
            <div id="analysisInfo"></div>
        </div>
    </div>
    <div id="mapDiv" data-dojo-type="dijit/layout/ContentPane" data-dojo-props="region:'center'">
        <img id="loader" src="loader.gif"/>
        <div id="legendContainer">
            <div id="legend"></div>
        </div>
    </div>
</div>
</body>

</html>