 Hide Table of Contents
 Analysis
 Dynamic Layers
 Editing
 Feature Layers
 Feature Table
 Graphics
 Map
Map
 Mobile
 Online and Portal
 Popups and Info Windows
 Query and Select
 Renderers, Symbols, Visualization
 Search

Color ramp symbols
Explore in the sandbox
Open in CodePen
View live sample
Description
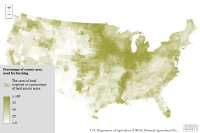
Renderer.setColorInfo() allows you to render quantitative data with color ramp (continuous color) without breaks. (Added at version 3.8 of the JS API)Code
<!DOCTYPE html>
<html>
  <head>
    <meta http-equiv="Content-Type" content="text/html; charset=utf-8">
    <meta name="viewport" content="initial-scale=1, maximum-scale=1,user-scalable=no"/>
    <title>Color Ramp</title>
    <link rel="stylesheet" href="https://js.arcgis.com/3.46/esri/css/esri.css">
    <style>
      html, body, #map {
        height: 100%;
        margin: 0;
      }
      #info {
        position: absolute;
        left: 0;
        bottom: 0;
        padding: 10px;
        background-color: #ddd;
        font: 14px Segoe UI;
        width: 200px;
        text-align: center;
        border-radius: 0 10px 0 0;
      }
    </style>
    <script src="https://js.arcgis.com/3.46/"></script>
    <script>
      require([
        "esri/map", "esri/geometry/Extent",
        "esri/layers/FeatureLayer", "esri/InfoTemplate", "esri/dijit/Legend",
        "esri/renderers/SimpleRenderer", "esri/Color",
        "esri/symbols/SimpleFillSymbol", "esri/symbols/SimpleLineSymbol",
        "dojo/domReady!"
      ], function(
        Map, Extent,
        FeatureLayer, InfoTemplate, Legend,
        SimpleRenderer, Color,
        SimpleFillSymbol, SimpleLineSymbol
      ) {
        var map = new Map("map", {
          extent: new Extent({"xmin":-2460944,"ymin":-1389910,"xmax":2297115,"ymax":1643787,"spatialReference":{"wkid":102003}})
        });

        var layer = new FeatureLayer("https://services.arcgis.com/V6ZHFr6zdgNZuVG0/arcgis/rest/services/USA_County_Crops_2007/FeatureServer/0", {
          outFields: ["*"],
          infoTemplate: new InfoTemplate("${COUNTY}, ${STATE}", "<div style='font: 18px Segoe UI'>The percentage of the area of the county that represents farmland is <b>${M086_07:NumberFormat(places:0)}%</b>.</div>")
        });

        var legend = new Legend({
          map: map,
          layerInfos: [{ title: "Percentage of county area used for farming", layer: layer }]
        }, "legend");

        layer.on("load", function(){
          var renderer = new SimpleRenderer(new SimpleFillSymbol().setOutline(new SimpleLineSymbol().setWidth(0.1).setColor(new Color([128,128,128]))));
          renderer.setColorInfo({
            field: "M086_07",
            minDataValue: 0,
            maxDataValue: 100,
            colors: [
              new Color([255, 255, 255]),
              new Color([127, 127, 0])
            ]
          });
          layer.setRenderer(renderer);
          map.addLayer(layer);
          legend.startup();
        });
      });
    </script>
  </head>
  <body>
    <div id="map"></div>
    <div id="info"><div id="legend"></div></div>
  </body>
</html>