 Hide Table of Contents
 Analysis
 Dynamic Layers
 Editing
 Feature Layers
 Feature Table
 Graphics
 Map
Map
 Mobile
 Online and Portal
 Popups and Info Windows
 Query and Select
 Renderers, Symbols, Visualization
 Search

Geometry Service - Buffer
Explore in the sandbox
Open in CodePen
View live sample
Description
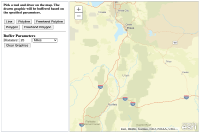
Use an ArcGIS Server geometry service to buffer graphics that you draw on the map. The geometry service can perform buffering, project features and calculate measurements in browser-based applications.
To create a buffer using the geometry service, create an instance of BufferParameters and specify distance, unit and spatial reference. Then call buffer, passing in the parameters and a callback function to execute when the buffer completes.
gsvc.buffer(params, function(features) { showBuffer(features);});
The callback function can add the buffer to the map, or it can perform additional analysis based on the buffer.
Note:
- The line and polygon drawing tools in this sample use the Draw toolbar. The geometry captured by the toolbar is set as the input geometry for the buffer. If the geometry is a polygon, the application uses the geometry service to simplify the polygon before sending it to be buffered. This is to catch topologically illegal polygons whose boundaries might cross themselves. The simplify operation breaks the polygons into legal, multipart features.
Code
<!DOCTYPE html>
<html>
<head>
  <meta http-equiv="Content-Type" content="text/html; charset=utf-8">

<meta name="viewport" content="initial-scale=1, maximum-scale=1,user-scalable=no">
<title>Buffer</title>

<link rel="stylesheet" href="https://js.arcgis.com/3.46/dijit/themes/claro/claro.css">
<link rel="stylesheet" href="https://js.arcgis.com/3.46/esri/css/esri.css">
<style>
   html, body {
    height: 100%;
    width: 100%;
    margin: 0;
    padding: 0;
    overflow:hidden;
  }
  #leftPane{
    color:#000;
    width:250px;
    padding-bottom:15px;
  }
  #map{
    padding:0;
  }
  .details{
    font-size:14px;
    font-weight:600;
    padding-bottom:20px;
  }

  button{
    margin:2px;
    cursor:pointer;
  }
</style>

<script src="https://js.arcgis.com/3.46/"></script>
<script>
var map, tb;

require(["dojo/dom",

        "dojo/_base/array",
        "dojo/parser",
        "dojo/query",
        "dojo/on",

        "esri/Color",
        "esri/config",
        "esri/map",
        "esri/graphic",

        "esri/geometry/normalizeUtils",
        "esri/tasks/GeometryService",
        "esri/tasks/BufferParameters",

        "esri/toolbars/draw",

        "esri/symbols/SimpleMarkerSymbol",
        "esri/symbols/SimpleLineSymbol",
        "esri/symbols/SimpleFillSymbol",

        "dijit/layout/BorderContainer",
        "dijit/layout/ContentPane",
        "dijit/form/Button", "dojo/domReady!"
        ],
      function(dom, array, parser, query, on, Color, esriConfig, Map, Graphic, normalizeUtils, GeometryService, BufferParameters, Draw, SimpleMarkerSymbol, SimpleLineSymbol, SimpleFillSymbol){

        parser.parse();


        esriConfig.defaults.geometryService = new GeometryService("https://utility.arcgisonline.com/ArcGIS/rest/services/Geometry/GeometryServer");

       //Setup button click handlers
        on(dom.byId("clearGraphics"), "click", function(){
          if(map){
            map.graphics.clear();
          }
        });
        //click handler for the draw tool buttons
        query(".tool").on("click", function(evt){
          if(tb){
           tb.activate(evt.target.id);
          }
        });

        map = new Map("map", {
          basemap: "streets-vector",
          center: [-111.5, 39.541],
          zoom: 7
        });
        map.on("load", initToolbar);


      function initToolbar(evtObj) {
        tb = new Draw(evtObj.map);
        tb.on("draw-end", doBuffer);
      }

      function doBuffer(evtObj) {
        tb.deactivate();
        var geometry = evtObj.geometry, symbol;
        switch (geometry.type) {
           case "point":
             symbol = new SimpleMarkerSymbol(SimpleMarkerSymbol.STYLE_SQUARE, 10, new SimpleLineSymbol(SimpleLineSymbol.STYLE_SOLID, new Color([255,0,0]), 1), new Color([0,255,0,0.25]));
             break;
           case "polyline":
             symbol = new SimpleLineSymbol(SimpleLineSymbol.STYLE_DASH, new Color([255,0,0]), 1);
             break;
           case "polygon":
             symbol = new SimpleFillSymbol(SimpleFillSymbol.STYLE_NONE, new SimpleLineSymbol(SimpleLineSymbol.STYLE_DASHDOT, new Color([255,0,0]), 2), new Color([255,255,0,0.25]));
             break;
        }

          var graphic = new Graphic(geometry, symbol);
          map.graphics.add(graphic);

          //setup the buffer parameters
          var params = new BufferParameters();
          params.distances = [ dom.byId("distance").value ];
          params.outSpatialReference = map.spatialReference;
          params.unit = GeometryService[dom.byId("unit").value];
          //normalize the geometry

          normalizeUtils.normalizeCentralMeridian([geometry]).then(function(normalizedGeometries){
            var normalizedGeometry = normalizedGeometries[0];
            if (normalizedGeometry.type === "polygon") {
              //if geometry is a polygon then simplify polygon.  This will make the user drawn polygon topologically correct.
              esriConfig.defaults.geometryService.simplify([normalizedGeometry], function(geometries) {
                params.geometries = geometries;
                esriConfig.defaults.geometryService.buffer(params, showBuffer);
              });
            } else {
              params.geometries = [normalizedGeometry];
              esriConfig.defaults.geometryService.buffer(params, showBuffer);
            }

          });
        }

        function showBuffer(bufferedGeometries) {
          var symbol = new SimpleFillSymbol(
            SimpleFillSymbol.STYLE_SOLID,
            new SimpleLineSymbol(
              SimpleLineSymbol.STYLE_SOLID,
              new Color([255,0,0,0.65]), 2
            ),
            new Color([255,0,0,0.35])
          );

          array.forEach(bufferedGeometries, function(geometry) {
            var graphic = new Graphic(geometry, symbol);
            map.graphics.add(graphic);
          });

        }
  });
</script>

</head>

<body class="claro">
<div data-dojo-type="dijit/layout/BorderContainer"
     data-dojo-props="gutters:'true', design:'sidebar'"
     style="width:100%;height:100%;">

  <div id="map"
       data-dojo-type="dijit/layout/ContentPane"
       data-dojo-props="region:'center'">
  </div>

  <div id="leftPane"
       data-dojo-type="dijit/layout/ContentPane"
       data-dojo-props="region:'left'">
    <div class="details">Pick a tool and draw on the map. The drawn graphic will be buffered based on the specified parameters.</div>
    <button type="button" class="tool" id="line">Line</button>
    <button type="button" class="tool" id="polyline">Polyline</button>
    <button type="button" class="tool" id="freehandpolyline">Freehand Polyline</button>
    <br/>
    <button type="button" class="tool" id="polygon">Polygon</button>
    <button type="button" class="tool" id="freehandpolygon">Freehand Polygon</button>
    <br/><hr />
    <div><b>Buffer Parameters</b></div>
    Distance: <input type="text" id="distance" size="5" value="25" />
    <select id="unit" style="width:100px;">
      <option value="UNIT_STATUTE_MILE">Miles</option>
      <option value="UNIT_FOOT">Feet</option>
      <option value="UNIT_KILOMETER">Kilometers</option>
      <option value="UNIT_METER">Meters</option>
      <option value="UNIT_NAUTICAL_MILE">Nautical Miles</option>
      <option value="UNIT_US_NAUTICAL_MILE">US Nautical Miles</option>
      <option value="UNIT_DEGREE">Degrees</option>
    </select><br />
    <button type="button" id="clearGraphics">Clear Graphics</button>
  </div>
</div>
</body>
</html>