 Hide Table of Contents
 Analysis
 Dynamic Layers
 Editing
 Feature Layers
 Feature Table
 Graphics
 Map
Map
 Mobile
 Online and Portal
 Popups and Info Windows
 Query and Select
 Renderers, Symbols, Visualization
 Search

Table source from ArcGIS Server
Explore in the sandbox
Open in CodePen
View live sample
Description
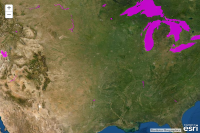
This sample demonstrates how to work with a feature layer with a dynamic data source. The data source for the feature layer is defined using esri/layers/TableDataSource.
Once the source is defined we can provide this to the feature layer constructor. Note that the FeatureLayer url doesn't have the layer id at the end like you might expect from a feature layer. In this case it ends with dynamicLayer. This only works with map service's where supportsDynamicLayers is true.
Requires ArcGIS Server 10.1 or greater
Code
<!DOCTYPE html>
<html>
  <head>
    <title>Dynamic Layer</title>
    <meta http-equiv="Content-Type" content="text/html; charset=utf-8">
    <meta name="viewport" content="initial-scale=1, maximum-scale=1,user-scalable=no">

    <link rel="stylesheet" href="https://js.arcgis.com/3.46/dijit/themes/claro/claro.css">
    <link rel="stylesheet" href="https://js.arcgis.com/3.46/esri/css/esri.css">
    <style>
    html, body, #mapDiv, .map.container {
      padding:0;
      margin:0;
      height:100%;
    }
    </style>

    <script src="https://js.arcgis.com/3.46/"></script>
    <script>
    var map;
    require([
      "esri/map", "esri/layers/FeatureLayer", "esri/InfoTemplate",
      "esri/tasks/GeometryService",
      "esri/layers/TableDataSource", "esri/layers/LayerDataSource",
      "esri/symbols/SimpleFillSymbol", "esri/renderers/SimpleRenderer",
      "esri/config",
      "esri/Color", "dojo/domReady!"
    ], function(
      Map, FeatureLayer, InfoTemplate,
      GeometryService,
      TableDataSource, LayerDataSource,
      SimpleFillSymbol, SimpleRenderer,
      esriConfig,
      Color
    ) {
      esriConfig.defaults.geometryService = new GeometryService("https://utility.arcgisonline.com/ArcGIS/rest/services/Geometry/GeometryServer");

      map = new Map("mapDiv", {
        basemap: "satellite",
        center: [0, 0],
        zoom: 2
      });

      map.on("load", initOperationalLayer);

      function initOperationalLayer() {

        var content = "<b>Name</b>: ${name}" + "<br /><b>Area</b>: ${ss6.gdb.Lakes.area:NumberFormat(places:0)}";
        var infoTemplate = new InfoTemplate("Dynamic Layer", content);

        //define the layer's data source from a table
        var dataSource = new TableDataSource();
        dataSource.workspaceId = "MyDatabaseWorkspaceIDSSR2";
        dataSource.dataSourceName = "ss6.gdb.Lakes";
        var layerSource = new LayerDataSource();
        layerSource.dataSource = dataSource;

        //create a new feature layer based on the table data source
        var featureLayer = new FeatureLayer("https://sampleserver6.arcgisonline.com/arcgis/rest/services/USA/MapServer/dynamicLayer", {
          mode: FeatureLayer.MODE_ONDEMAND,
          outFields: ["*"],
          infoTemplate: infoTemplate,
          source: layerSource
        });

        featureLayer.on("load", function(evt){
          //project the extent if the map's spatial reference is different that the layer's extent.
          var gs = esriConfig.defaults.geometryService;
          var extent = evt.layer.fullExtent;
          if ( extent.spatialReference.wkid === map.spatialReference.wkid ) {
            map.setExtent(extent);
          } else {
            gs.project([extent], map.spatialReference).then(function (results) {
              map.setExtent(results[0]);
            });
          }
        });

        var renderer = new SimpleRenderer(
          new SimpleFillSymbol("solid", null, new Color([255, 0, 255, 0.75]) // fuschia lakes!
        ));

        featureLayer.setRenderer(renderer);
        map.addLayer(featureLayer);
        map.infoWindow.resize(150, 105);
      }
    });
    </script>
  </head>

  <body class="claro">
    <div id="mapDiv"></div>
  </body>

</html>