 Hide Table of Contents
 Analysis
 Dynamic Layers
 Editing
 Feature Layers
 Feature Table
 Graphics
 Map
Map
 Mobile
 Online and Portal
 Popups and Info Windows
 Query and Select
 Renderers, Symbols, Visualization
 Search

SVG and CSS to style polygons
Explore in the sandbox
View live sample
Description
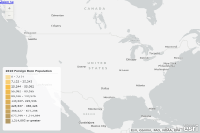
Style polygon features using CSS. County polygons are shaded according to the total foreign born population. A CSS animation is used to gradually change county boundaries as the mouse cursor moves across the map. Not supported in browsers that do not support SVG.Code
<!DOCTYPE html>
<html>
<head>
<meta http-equiv="Content-Type" content="text/html; charset=utf-8">
<meta name="viewport" content="initial-scale=1, maximum-scale=1,user-scalable=no">
<title>2010 Foreign Born Population</title>

<link rel="stylesheet" href="https://js.arcgis.com/3.46/esri/css/jsapi.css"/>
<link rel="stylesheet" href="slider.css"/>

<style>
    html, body {
        height: 100%;
        width: 100%;
        margin: 0;
        padding: 0;
        font-size: 0.90em;
        font-family: Verdana, Helvetica, sans-serif;
        color: #282a2c;
    }

    #map {
        height: 100%;
        width: 100%;
    }

    #legend {
        left: 1em;
        bottom: 1em;
        position: absolute;
        height: 265px;
        width: 210px;
        background-color: #FFFFFF;
        opacity: 0.85;
        border-radius: 7px;
        z-index: 999;
        padding: 1em;
        font-size: 0.85em;
    }

    #header {
        font-weight: bold;
    }

        /* styles applied to features */
    path[data-classbreak="classbreak0"] {
        stroke: rgb(255, 245, 220);
        stroke-width: 1pt;
        stroke-opacity: 0.35;
        fill: rgb(255, 215, 120);
        fill-opacity: 0.8;
    }

    path[data-classbreak="classbreak1"] {
        stroke: rgb(255, 233, 185);
        stroke-width: 1pt;
        stroke-opacity: 0.35;
        fill: rgb(255, 193, 60);
        fill-opacity: 0.8;
    }

    path[data-classbreak="classbreak2"] {
        stroke: rgb(255, 220, 150);
        stroke-width: 1pt;
        stroke-opacity: 0.35;
        fill: rgb(255, 170, 0);
        fill-opacity: 0.8;
    }

    path[data-classbreak="classbreak3"] {
        stroke: rgb(253, 210, 120);
        stroke-width: 1pt;
        stroke-opacity: 0.35;
        fill: rgb(241, 162, 6);
        fill-opacity: 0.8;
    }

    path[data-classbreak="classbreak4"] {
        stroke: rgb(250, 200, 90);
        stroke-width: 1pt;
        stroke-opacity: 0.35;
        fill: rgb(226, 154, 11);
        fill-opacity: 0.8;
    }

    path[data-classbreak="classbreak5"] {
        stroke: rgb(248, 186, 60);
        stroke-width: 1pt;
        stroke-opacity: 0.35;
        fill: rgb(211, 146, 17);
        fill-opacity: 0.8;
    }

    path[data-classbreak="classbreak6"] {
        stroke: rgb(245, 172, 29);
        stroke-width: 1pt;
        stroke-opacity: 0.35;
        fill: rgb(196, 138, 23);
        fill-opacity: 0.8;
    }

    path[data-classbreak="classbreak7"] {
        stroke: rgb(227, 163, 36);
        stroke-width: 1pt;
        stroke-opacity: 0.35;
        fill: rgb(182, 131, 29);
        fill-opacity: 0.8;
    }

    path[data-classbreak="classbreak8"] {
        stroke: rgb(209, 154, 43);
        stroke-width: 1pt;
        stroke-opacity: 0.35;
        fill: rgb(167, 123, 34);
        fill-opacity: 0.8;
    }

    path[data-classbreak="classbreak9"] {
        stroke: rgb(190, 144, 53);
        stroke-width: 1pt;
        stroke-opacity: 0.35;
        fill: rgb(152, 115, 40);
        fill-opacity: 0.8;
    }

        /* mouse hover animation */
    @keyframes highlight {
        100% {
            fill-opacity: 1;
            stroke-width: 4;
            stroke: rgb(220, 20, 60);
        }
    }

    @-webkit-keyframes highlight {
        100% {
            fill-opacity: 1;
            stroke-width: 4;
            stroke: rgb(220, 20, 60);
        }
    }

    path:hover {
        cursor: pointer;
        animation-duration: 0.2s;
        animation-name: highlight;
        animation-timing-function: linear;
        animation-fill-mode: forwards;
        -webkit-animation-duration: 0.2s;
        -webkit-animation-name: highlight;
        -webkit-animation-timing-function: linear;
        -webkit-animation-fill-mode: forwards;
    }

</style>

<script src="https://js.arcgis.com/3.46/"></script>

<script>
    require([
        "esri/map",
        "esri/layers/FeatureLayer",
        "dojo/_base/array",
        "dojo/dom",
        "dojo/dom-construct",
        "dojo/on",
        "dojo/parser",
        "dojo/ready"
    ], function (Map, FeatureLayer, array, dom, domConstruct, on, parser, ready) {
        parser.parse();

        var map,
                classbreaks = [];

        ready(function () {

            classbreaks = [
                {
                    attribute:"classbreak0",
                    value:7121,
                    legendLabel:"0 - 7,121"
                },
                {
                    attribute:"classbreak1",
                    value:25243,
                    legendLabel:"7,122 - 25,243"
                },
                {
                    attribute:"classbreak2",
                    value:55082,
                    legendLabel:"25,244 - 55,082"
                },
                {
                    attribute:"classbreak3",
                    value:89166,
                    legendLabel:"55,082 - 89,165"
                },
                {
                    attribute:"classbreak4",
                    value:143527,
                    legendLabel:"89,166 - 143,526"
                },
                {
                    attribute:"classbreak5",
                    value:225537,
                    legendLabel:"143,527- 225,536"
                },
                {
                    attribute:"classbreak6",
                    value:388427,
                    legendLabel:"225,537 - 388,426"
                },
                {
                    attribute:"classbreak7",
                    value:677299,
                    legendLabel:"388,427 - 677,298"
                },
                {
                    attribute:"classbreak8",
                    value:1214895,
                    legendLabel:"677,299 - 1,214,894"
                },
                {
                    attribute:"classbreak9",
                    value:7121,
                    legendLabel:"1,214,895 or greater"
                }
            ];

            map = new Map("map", {
                basemap: "gray-vector",
                center: [-98.5795, 39.828175],
                zoom: 3
            });

            // draw legend items
            array.forEach(classbreaks, function (classbreak, i) {
                domConstruct.create("div", {
                    innerHTML:'<svg width="20" height="20" version="1.1" xmlns="http://www.w3.org/2000/svg">' +
                            '<path data-classbreak="' + classbreak.attribute + '" d="M 0 0 L 23 0 L 23 23 L 0 23 Z" />' +
                            '</svg><span style="vertical-align: top; padding-left: 3px">' + classbreak.legendLabel + '</span>'
                }, 'legend');
            });
            addFeatureLayer();
        });

        function addFeatureLayer() {
            var featureLayer = new FeatureLayer("https://services.arcgis.com/V6ZHFr6zdgNZuVG0/arcgis/rest/services/fbTrim/FeatureServer/0", {
                id:"featureLayer",
                styling:false,
                dataAttributes:["fb_pop"]
            });

            on(featureLayer, "mouse-over", function (evt) {
                console.log("FB: " + evt.graphic.attributes.fb_pop);
            });

            if (featureLayer.surfaceType === "svg") {
                on(featureLayer, "graphic-draw", function (evt) {
                    var tableAttr = evt.graphic.attributes.fb_pop;
                    var category;
                    if (tableAttr < classbreaks[0].value) {
                        category = classbreaks[0].attribute;
                    } else if (tableAttr >= classbreaks[0].value && tableAttr < classbreaks[1].value) {
                        category = classbreaks[1].attribute;
                    } else if (tableAttr >= classbreaks[1].value && tableAttr < classbreaks[2].value) {
                        category = classbreaks[2].attribute;
                    } else if (tableAttr >= classbreaks[2].value && tableAttr < classbreaks[3].value) {
                        category = classbreaks[3].attribute;
                    } else if (tableAttr >= classbreaks[3].value && tableAttr < classbreaks[4].value) {
                        category = classbreaks[4].attribute;
                    } else if (tableAttr >= classbreaks[4].value && tableAttr < classbreaks[5].value) {
                        category = classbreaks[5].attribute;
                    } else if (tableAttr >= classbreaks[5].value && tableAttr < classbreaks[6].value) {
                        category = classbreaks[6].attribute;
                    } else if (tableAttr >= classbreaks[6].value && tableAttr < classbreaks[7].value) {
                        category = classbreaks[7].attribute;
                    } else if (tableAttr >= classbreaks[7].value && tableAttr < classbreaks[8].value) {
                        category = classbreaks[8].attribute;
                    } else if (tableAttr >= classbreaks[8].value) {
                        category = classbreaks[9].attribute;
                    }

                    // set the data attribute for the current feature
                    evt.node.setAttribute("data-classbreak", category);
                });
            } else {
                alert("Your browser does not support SVG.\nPlease user a modern web browser that supports SVG.");
                dom.byId("legend").innerHTML = "Your browser does not support SVG.";
            }
            map.addLayer(featureLayer);
            return featureLayer;
        }
    });
</script>
</head>

<body>
<div id="map"></div>
<div id="legend">
    <div id="header">2010 Foreign Born Population</div>
    <hr/>
</div>
</body>

</html>