 Hide Table of Contents
 Analysis
 Dynamic Layers
 Editing
 Feature Layers
 Feature Table
 Graphics
 Map
Map
 Mobile
 Online and Portal
 Popups and Info Windows
 Query and Select
 Renderers, Symbols, Visualization
 Search

FeatureTable - Formatting
Explore in the sandbox
Open in CodePen
View live sample
Description
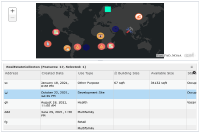
This sample shows how to use different properties of FeatureTable class to format the look and feel of the table and its data. User can update the attributes of the existing features displayed in the table. The table also displays attachments.
- FeatureTable.editableproperty is set to true. User can update existing attributes in the table.
- FeatureTable.showAttachments property is set to true. User can view and remove existing attachments, or add new attachments to existing features.
- FeatureTable.syncSelection property is set to true. This enables selection from the table to the map.
- FeatureTable.zoomToSelection property is set to true. The map will zoom to the selected feature on the map as user selects a row in the table.
- FeatureTable.gridOptions property is used to set the underlying grid properties. In this case, the table will allow users to select all rows using ctrl + A command and select text in the table.
- FeatureTable.dateOptions property is used to display date fields using the specified format.
- FeatureTable.outFields property controls the order of the fields displayed in the table. If you don't list given fields in the outfields property then these fields will be hidden when the table initializes.
- FeatureTable.fieldInfos property will let you format the specified fields to meet your needs. You can change editable, alias property of the field. You can also format text, number, domain and subtypes using fieldInfos.format property.
Code
<!DOCTYPE html>
<html>
<head>
  <meta http-equiv="Content-Type" content="text/html; charset=utf-8">
  <meta name="viewport" content="initial-scale=1, maximum-scale=1,user-scalable=no"/>
  <title>FeatureTable Formatting</title>
  <link rel="stylesheet" href="https://js.arcgis.com/3.46/dijit/themes/claro/claro.css">
  <link rel="stylesheet" href="https://js.arcgis.com/3.46/esri/css/esri.css">
  <script src="https://js.arcgis.com/3.46/"></script>

  <style>
    html, body, #map {
      width: 100%;
      height: 100%;
      margin: 0;
      padding: 0;
    }
  </style>

  <script>
    require([
      "esri/layers/FeatureLayer",
      "esri/dijit/FeatureTable",
      "esri/geometry/Extent",
      "esri/symbols/SimpleMarkerSymbol",
      "esri/symbols/SimpleLineSymbol",
      "esri/Color",
      "esri/map",
      "dojo/dom-construct",
      "dojo/dom",
      "dojo/number",
      "dojo/parser",
      "dojo/ready",
      "dojo/on",
      "dojo/_base/lang",
      "dijit/registry",
      "dijit/form/Button",
      "dijit/layout/ContentPane",
      "dijit/layout/BorderContainer",
      "dijit/form/TextBox"
    ], function (
      FeatureLayer, FeatureTable, Extent, SimpleMarkerSymbol, SimpleLineSymbol, Color, Map,
      domConstruct, dom, dojoNum, parser, ready, on,lang,
      registry, Button, ContentPane, BorderContainer, TextBox
    ) {

      parser.parse();

      ready(function(){

        var map = new Map("map",{
          basemap: "dark-gray-vector"
        });

        map.on("load", loadTable);

        function loadTable(){
         var myFeatureLayer = new FeatureLayer("https://services.arcgis.com/V6ZHFr6zdgNZuVG0/arcgis/rest/services/New_Real_Estate/FeatureServer/0",{
            mode: FeatureLayer.MODE_ONDEMAND,
            outFields: ["*"],
            visible: true,
            id: "fLayer"
          });

          // set a selection symbol for the featurelayer
          var selectionSymbol =  new SimpleMarkerSymbol(SimpleMarkerSymbol.STYLE_SQUARE, 12,
            new SimpleLineSymbol(SimpleLineSymbol.STYLE_SOLID, new Color([0, 255, 197, 1])));
          myFeatureLayer.setSelectionSymbol(selectionSymbol);

          map.addLayer(myFeatureLayer);

          // create new FeatureTable and set its properties
          var myFeatureTable = new FeatureTable({
            featureLayer : myFeatureLayer,
            map : map,
            showAttachments: true,
            // only allows selection from the table to the map
            syncSelection: true,
            zoomToSelection: true,
            gridOptions: {
              allowSelectAll: true,
              allowTextSelection: true,
            },
            editable: true,
            dateOptions: {
              // set date options at the feature table level
              // all date fields will adhere this
              datePattern: "MMMM d, y"
            },
            // define order of available fields. If the fields are not listed in 'outFields'
            // then they will not be available when the table starts.
            outFields: ["Address", "Created_Date", "Use_Type", "Building_Size_Sqft", 'Available_Size_Sqft',
              "Status", "Parking_Count", "Primary_Parking_Type", "Tenancy", "Floors"
            ],
            // use fieldInfos property to change field's label (column header),
            // the editability of the field, and to format how field values are displayed
            fieldInfos: [
              {
                name: 'Building_Size_Sqft',
                alias: 'Building Size',
                editable: false,
                format: {
                  template: "${value} sqft"
                }
              },
              {
                name: 'Available_Size_Sqft',
                alias: 'Available Size',
                format: {
                  template: "${value} sqft"
                }
              },
              {
                name: 'Primary_Parking_Type',
                format: {
                  template: "${value} parking"
                }
              }
            ],
          }, 'myTableNode');

          myFeatureTable.startup();

          // listen to show-attachments event
          myFeatureTable.on("show-attachments", function(evt){
            console.log("show-attachments event - ", evt);
          });
        }
      });
    });
  </script>
</head>
<body class="claro esri">
  <div data-dojo-type="dijit/layout/BorderContainer" data-dojo-props="design:'headline'" style="width:100%; height:100%;">
    <div data-dojo-type="dijit/layout/ContentPane" data-dojo-props="region:'center', splitter:true" style="height:50%">
      <div id="map"></div>
    </div>
    <div id="bot" data-dojo-type="dijit/layout/ContentPane" data-dojo-props="region:'bottom', splitter:true" style="height:50%">
      <div id="myTableNode"></div>
    </div>
  </div>
</body>
</html>