 Hide Table of Contents
 Analysis
 Dynamic Layers
 Editing
 Feature Layers
 Feature Table
 Graphics
 Map
Map
 Mobile
 Online and Portal
 Popups and Info Windows
 Query and Select
 Renderers, Symbols, Visualization
 Search

SVG and CSS using D3
Explore in the sandbox
Open in CodePen
View live sample
Description
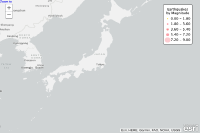
This sample uses the D3 toolkit to define data classification and apply a style to each range of values.Code
<!DOCTYPE html>
<html>
<head>
    <meta http-equiv="Content-Type" content="text/html; charset=utf-8">
    <title>Quantize</title>

    <link rel="stylesheet" href="https://js.arcgis.com/3.46/esri/css/jsapi.css"/>

    <style>
        html, body {
            height: 100%;
            width: 100%;
            margin: 0;
            padding: 0;
        }

        #map {
            height: 100%;
            width: 100%;
        }

        path[data-classification="0"] {
            fill: none;
            stroke: #f5cb00;
            stroke-width: 3;
            stroke-opacity: 1;
            stroke-linecap: round;
            stroke-linejoin: round;
        }

        path[data-classification="1"] {
            fill: none;
            stroke: #f67682;
            stroke-width: 5;
            stroke-opacity: 0.85;
            stroke-linecap: round;
            stroke-linejoin: round;
        }

        path[data-classification="2"] {
            fill: none;
            stroke: #f75e64;
            stroke-width: 8;
            stroke-opacity: 0.7;
            stroke-linecap: round;
            stroke-linejoin: round;
        }

        path[data-classification="3"] {
            fill: none;
            stroke: #f72d3f;
            stroke-width: 11;
            stroke-opacity: 0.45;
            stroke-linecap: round;
            stroke-linejoin: round;
        }

        path[data-classification="4"] {
            fill: none;
            stroke: #F70019;
            stroke-width: 22;
            stroke-opacity: 0.2;
            stroke-linecap: round;
            stroke-linejoin: round;
        }

        #legend svg {
            vertical-align: middle;
        }
    </style>

    <script src="https://d3js.org/d3.v3.min.js"></script>

    <script src="https://js.arcgis.com/3.46/"></script>

    <script>
        require([
            "esri/map",
            "esri/layers/FeatureLayer",
            "dojo/_base/array",
            "dojo/dom",
            "dojo/number",
            "dojo/on",
            "dojo/parser",
            "dojo/ready"
        ], function (Map, FeatureLayer, array, dom, number, on, parser, ready) {
            parser.parse();

            var map, layer, quantize;

            ready(function () {
                map = new Map("map", {
                    basemap: "gray-vector",
                    center: [139.742661, 35.371135],
                    zoom: 4
                });
                addEarthquakes();
            });

            function addEarthquakes() {
                var earthquakes = new FeatureLayer("https://sampleserver6.arcgisonline.com/arcgis/rest/services/Earthquakes_Since1970/FeatureServer/0", {
                    id:"earthquakes",
                    styling:false
                });

                // Apply D3's Quantitative Scales
                if (earthquakes.surfaceType === "svg") {
                    // construct a linear quantitative scale with a discrete output range
                    // A scale's input domain is the range of possible input data values
                    quantize = d3.scale.quantize().domain([0, 9]).range(d3.range(5));

                    on(earthquakes, "graphic-draw", function (evt) {
                        var attrs = evt.graphic.attributes, magnitude = (attrs && attrs.magnitude) || undefined, range;
                        range = quantize(magnitude);
                        evt.node.setAttribute("data-classification", range);
                    });
                    createLegend();
                } else {
                    alert("Your browser does not support SVG.\nPlease user a modern web browser that supports SVG.");
                    dom.byId("legend").innerHTML = "Your browser does not support SVG.";
                }
                map.addLayer(earthquakes);
                return earthquakes;
            }

            function createLegend() {
                var swatchTemplate =
                        '<div>' +
                                '<svg width="24" height="24" version="1.1" xmlns="https://www.w3.org/2000/svg">' +
                                '<path d="M 11 11 L 12 11 L 12 12 L 11 12 Z" data-classification="${classification}" />' +
                                '</svg>' +
                                '<span>${label}</span>' +
                                '</div>';

                var html = "", inverted, data, legend = dom.byId("legend");

                // quantize.range() returns the scale's current output range
                array.forEach(quantize.range(), function (rangeVal) {
                    // Returns the extent of values in the input domain [x0, x1] for the corresponding value in the output range y
                    inverted = quantize.invertExtent(rangeVal);

                    data = {
                        label:number.format(inverted[0], { places:2 }) + " - " + number.format(inverted[1], { places:2 }),
                        classification:rangeVal
                    };
                    html += esri.substitute(data, swatchTemplate);
                });
                legend.innerHTML = legend.innerHTML + html;
            }
        });
    </script>
</head>

<body>
<div id="map">


    <div style="font-family: Lucida Grande,Helvetica,Arial,Verdana,sans-serif; font-size: 14px; position: absolute; right: 30px; top: 20px; z-index: 100; padding: 5px; border: 2px solid #666666; border-radius: 5px; background-color: white;">

        <div id="legend">
            <div style="padding: 6px; text-align: center;">
                Earthquakes <br/> by Magnitude
            </div>
        </div>

    </div>

</div>
</body>

</html>