 Hide Table of Contents
 Analysis
 Dynamic Layers
 Editing
 Feature Layers
 Feature Table
 Graphics
 Map
Map
 Mobile
 Online and Portal
 Popups and Info Windows
 Query and Select
 Renderers, Symbols, Visualization
 Search

Update legend text with renderer
Explore in the sandbox
Open in CodePen
View live sample
Description
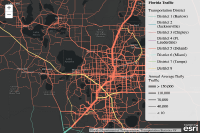
This sample shows how to alter the text of a legend through the renderer's properties.
Whether you're creating a UniqueValueRenderer, a ClassBreaksRenderer, or a SimpleRenderer with visual variables, the text shown in the legend is always handled in the renderer. The data in this sample is rendered with a UniqueValueRenderer and a SizeInfo visualVariable to depict traffic counts in Florida. Notice how the legend label for each symbol of the UniqueValueRenderer is created inside each addValue() method. Similarly, the numbers for the traffic counts in the legend are set in the sizeInfo object.
The infos property on each renderer may also be used to control the text and symbols used in the legend.
Code
<!DOCTYPE html>
<html>
<head>
<meta http-equiv="Content-Type" content="text/html; charset=utf-8">
<meta name="viewport" content="initial-scale=1, maximum-scale=1, user-scalable=no">

<title>MultiVariant linear visualization</title>

<link rel="stylesheet" href="https://js.arcgis.com/3.46/esri/css/esri.css">
<script src="https://js.arcgis.com/3.46/"></script>

<style>
  html, body, #map{
    height: 100%;
    width: 100%;
    padding: 0;
    margin: 0;
  }
  #info{
    top: 0px;
    right: 0px;
    position: absolute;
    z-index: 99;
    opacity: 0.9;
    background-color: whitesmoke;
    border-bottom-left-radius: 8px;
    padding: 0px 0px 0px 10px;
  }
</style>

<script>
require([
  "esri/map",
  "esri/Color",
  "esri/layers/FeatureLayer",
  "esri/renderers/UniqueValueRenderer",
  "esri/symbols/SimpleLineSymbol",
  "esri/dijit/PopupTemplate",
  "esri/dijit/Legend",
  "dojo/domReady!"
], function(
  Map, Color,
  FeatureLayer,
  UniqueValueRenderer,
  SimpleLineSymbol,
  PopupTemplate,
  Legend
) {

  var map = new Map("map", {
    basemap: "dark-gray-vector",
    center: [ -81.457, 28.591 ],
    zoom: 9
  });

  /******************************************************
  * The PopupTemplate can be used to override the
  * field name or default field alias for fields
  * in the legend. Without the 'label' property in
  * each fieldInfo object below, the fields in the
  * legend would read "DISTRICT" and "AADT" respectivly.
  *
  * Adding a label in the PopupTemplate allows you
  * to format and re-write the titles for each field
  * so they're more descriptive
  *****************************************************/
  var template = new PopupTemplate({
    title: "District {DISTRICT}",
    description: "{*}",
    fieldInfos: [{
      fieldName: "DISTRICT",
      label: "Transportation District",
      format: { places: 0, digitSeparator: true }
    }, {
      fieldName: "AADT",
      label: "Annual Average Daily Traffic",
      format: { places: 0, digitSeparator: true }
    }]
  });

  var url = "https://services.arcgis.com/V6ZHFr6zdgNZuVG0/arcgis/rest/services/Florida_Annual_Average_Daily_Traffic/FeatureServer/0";
  var layer = new FeatureLayer(url, {
    mode: FeatureLayer.MODE_AUTO,
    outFields: "*",
    infoTemplate: template  //Apply the PopupTemplate to the layer
  });

  //Create a unique value renderer and its unique value info
  var renderer = new UniqueValueRenderer(null, "DISTRICT");

  //This function will be used to create symbols for each unique value
  function createSymbol (color) {
    return new SimpleLineSymbol(SimpleLineSymbol.STYLE_SOLID, new Color(color), 1.5);
  }

  /*****************************************************************
  * The addValue() method allows you to pass an object
  * as a method parameter. The 'value' and 'symbol' properties
  * are required to properly render the data. By default,
  * the value of the 'value' property is used in the legend
  * to identify the symbols. However, you may use the 'label'
  * property to customize the text in the legend identifying
  * each symbol. This allows for creating more visually appealing
  * and informative legends.
  ******************************************************************/
  renderer.addValue({
    value: "1",
    symbol: createSymbol("#6EC4AE"),
    label: "District 1 (Bartow)",
    description: "SW Florida"
  });
  renderer.addValue({
    value: "2",
    symbol: createSymbol("#37A9B7"),
    label: "District 2 (Jacksonville)",
    description: "Northeast Florida"
  });
  renderer.addValue({
    value: "3",
    symbol: createSymbol("#D68989"),
    label: "District 3 (Chipley)",
    description: "Northwest Florida"
  });
  renderer.addValue({
    value: "4",
    symbol: createSymbol("#BC7EBA"),
    label: "District 4 (Ft. Lauderdale)",
    description: "Southeast Florida"
  });
  renderer.addValue({
    value: "5",
    symbol: createSymbol("#F97B60"),
    label: "District 5 (Deland)",
    description: "Central Florida"
  });
  renderer.addValue({
    value: "6",
    symbol: createSymbol("#7BFAEB"),
    label: "District 6 (Miami)",
    description: "South Florida"
  });
  renderer.addValue({
    value: "7",
    symbol: createSymbol("#A1D77E"),
    label: "District 7 (Tampa)",
    description: "West Central Florida"
  });
  renderer.addValue({
    value: "8",
    symbol: createSymbol("#FBDE7F"),
    label: "District 8",
    description: ""
  });

 /**********************************************
  * Define a size visual variable to vary the width
  * of each highway based on its annual average daily
  * traffic count.
  *********************************************/
  renderer.setVisualVariables([{
      type: "sizeInfo",
      field: "AADT",
      valueUnit: "unknown",
      minSize: 0.75,
      maxSize: 8.25,
      minDataValue: 10,
      maxDataValue: 150000
    }]);

  //Set the renderer on the layer and add the layer to the map
  layer.setRenderer(renderer);
  map.addLayer(layer);

  /*************************************************************
  * The legend requires minimal code. All you need here is
  * a reference to the layer(s) to display in the legend and a
  * title. The symbols and their labels will automatically be
  * taken from the renderer as you defined them earlier.
  **************************************************************/

  map.on("load", function(evt){
    var legend = new Legend({
      map: map,
      layerInfos: [{
        layer: layer,
        title: "Florida Traffic"
      }]
    }, "legendDiv");

    legend.startup();
  });
});
</script>
</head>
<body>
  <div id="map"></div>
  <div id="info"><div id="legendDiv"></div></div>
</body>
</html>