 Hide Table of Contents
 Analysis
 Dynamic Layers
 Editing
 Feature Layers
 Feature Table
 Graphics
 Map
Map
 Mobile
 Online and Portal
 Popups and Info Windows
 Query and Select
 Renderers, Symbols, Visualization
 Search

Proportional symbols for lines
Explore in the sandbox
Open in CodePen
View live sample
Description
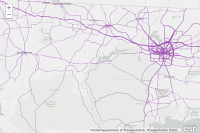
Create proportional symbols by having the line width be based on the data values of the features.
Code
<!DOCTYPE html>
<html>
  <head>
    <meta http-equiv="Content-Type" content="text/html; charset=utf-8">

    <meta name="viewport" content="initial-scale=1, maximum-scale=1,user-scalable=no">
    <title>Proportional Symbols on Road Traffic</title>
    <link rel="stylesheet" href="https://js.arcgis.com/3.46/esri/css/esri.css">
    <style>
      html, body, #map {
        height: 100%;
        width: 100%;
        margin: 0;
        padding: 0;
      }
      body {
        background-color: #FFF;
        overflow: hidden;
        font-family: "Trebuchet MS";
      }
    </style>
    <script src="https://js.arcgis.com/3.46/"></script>
    <script>
      var map;
      require([
        "esri/map", "esri/layers/FeatureLayer", "esri/InfoTemplate",
        "dojo/domReady!"
      ], function(
        Map, FeatureLayer, InfoTemplate
      ){

        map = new Map("map", {
          basemap: "gray-vector",
          center: [-84.63,30.37],
          zoom: 9
        });

        var template = new InfoTemplate("Florida Annual Average Traffic Count", "Traffic Count: <b>${AADT}</b><br>From: <b>${DESC_FRM}</b><br>To: <b>${DESC_TO}</b>");

        var layer = new FeatureLayer("https://services.arcgis.com/V6ZHFr6zdgNZuVG0/arcgis/rest/services/Florida_Annual_Average_Daily_Traffic/FeatureServer/0", {
          mode: FeatureLayer.MODE_ONDEMAND,
          outFields:["AADT", "DESC_FRM", "DESC_TO"],
          infoTemplate:template,
          minScale:1155581.108577
        });

        var sizeInfo = {
          field:"AADT",
          minSize:1,
          maxSize:10,
          minDataValue:1000,
          maxDataValue:100000
        };

        layer.on("load", function() {
          layer.renderer.setSizeInfo(sizeInfo);
          layer.copyright = "Florida Department of Transportation, Transportation Statistics Office (TRANSTAT)";
        });

        map.addLayers([layer]);
      });
    </script>
  </head>
  <body>
    <div id="map"></div>
  </body>
</html>