 Hide Table of Contents
 Analysis
 Dynamic Layers
 Editing
 Feature Layers
 Feature Table
 Graphics
 Map
Map
 Mobile
 Online and Portal
 Popups and Info Windows
 Query and Select
 Renderers, Symbols, Visualization
 Search

Geometry Engine - Geodesic buffers
Explore in the sandbox
Open in CodePen
View live sample
Description
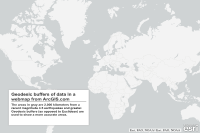
This sample demonstrates how to create geodesic buffers using Geometry Engine. The result depicts areas located within 2000km of an earthquake.
The map in this application is built from an existing map in ArcGIS Online. Features from a point layer inside the map are extracted and input as geometries into the geodesicBuffer() method of GeometryEngine. Additional parameters including buffer distance, units, and whether to union the resulting features are also passed into the method. As opposed to GeometryService, GeometryEngine processes buffers on the client, generating and displaying the resulting features quickly and seamlessly.
Code
<!DOCTYPE html>
<html>
<head>
<meta charset="utf-8">
<meta name="viewport" content="initial-scale=1, maximum-scale=1,user-scalable=no"/>
<title>Geodesic Buffers</title>
<link rel="stylesheet" href="https://js.arcgis.com/3.46/esri/css/esri.css" />
<style>
  html, body, #map { height: 100%; width: 100%; margin: 0; padding: 0; }

  h3 { margin: 0 0 5px 0; border-bottom: 1px solid #444; }
  .shadow {
    -moz-box-shadow: 0 0 5px #888;
    -webkit-box-shadow: 0 0 5px #888;
    box-shadow: 0 0 5px #888;
  }
  #feedback {
    background: #fff;
    bottom: 30px;
    color: #444;
    position: absolute;
    font-family: arial;
    height: 140px;
    left: 30px;
    margin: 5px;
    padding: 10px;
    width: 300px;
    z-index: 40;
  }
  #note { font-size: 80%; font-weight: 700; padding: 0 0 10px 0; }
</style>

<script src="https://js.arcgis.com/3.46/"></script>
<script>
require([
    "esri/Color",
    "dojo/_base/array",
    "esri/arcgis/utils",
    "esri/config",
    "esri/graphicsUtils",
    "esri/symbols/SimpleFillSymbol",
    "esri/graphic",
    "esri/geometry/geometryEngine",
    "dojo/domReady!"
], function(
    Color,
    array,
    arcgisUtils,
    config,
    graphicsUtils,
    SimpleFillSymbol,
    Graphic,
    geometryEngine
) {

    //csv file from a webserver (usgs.gov), basemap, rederer, custom popup are conatined in this simple webmap.
    var webmapId = "00fbe4fffaca422aa3fb6085a0f65ade";

    arcgisUtils.createMap(webmapId, "map",{
      mapOptions: {slider: false}
    }).then(function(response){
      var map = response.map;

      //when the map is ready geodesically buffer all features
      bufferEarthquakes(map);
    });

    function bufferEarthquakes(map){
      //Pull first layer from the webmap and use it as input for the buffer operation
      //Use GeometryEngine geodesicBuffer
      //buffers will have correct distance no matter what the spatial reference of the map is.

      var featureLayer = map.getLayer(map.graphicsLayerIds[0]);
      var geometries = graphicsUtils.getGeometries(featureLayer.graphics);

      //geodesicBuffer(geometries, [distance], unit, unionResults);
      var bufferedGeometries = geometryEngine.geodesicBuffer(geometries, [2000], "kilometers", true);

      //when buffer is done set up renderer and add each geometry to the map's graphics layer as a graphic
      var symbol = new SimpleFillSymbol();
      symbol.setColor(new Color([100,100,100,0.25]));
      symbol.setOutline(null);
      array.forEach(bufferedGeometries,function(geometry){
        map.graphics.add(new Graphic(geometry,symbol));
      });
    }
});

</script>
</head>

<body>
  <div id="map">
    <div id="feedback" class="shadow">
      <h3>Geodesic buffers of data in a webmap from ArcGIS.com</h3>
      <div id="info">
        <div id="note">
          The areas in gray are 2,000 kilometers from a recent magnitude 4.5 earthquakes and greater. Geodesic buffers (as opposed
          to Euclidean) are used to show a more accurate areas.
        </div>
      </div>
    </div>
  </div>
</body>
</html>