 Hide Table of Contents
 Analysis
 Dynamic Layers
 Editing
 Feature Layers
 Feature Table
 Graphics
 Map
Map
 Mobile
 Online and Portal
 Popups and Info Windows
 Query and Select
 Renderers, Symbols, Visualization
 Search

FeatureTable - related records
Explore in the sandbox
Open in CodePen
View live sample
Description
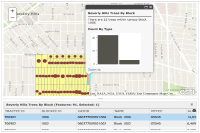
This sample demonstrates how to display related records as columns directly in the FeatureTable if the layer has relationship(s) defined. To display the related records, set FeatureTable.showRelatedRecords property to true. To help distinguish the related records from the fields in the FeatureTable, the related records columns are appended to the end of the FeatureTable with the column name shown in italics. Each record in the FeatureTable shows the number of related records associated with it. User can edit existing related records if the editable property of FeatureTable is set to true. The sample also demonstrates use of show-attachments event which fires when related records are displayed in the FeatureTable.
Code
<!DOCTYPE html>
<html>

<head>
  <meta http-equiv="Content-Type" content="text/html; charset=utf-8">
  <title>FeatureTable - related records</title>
  <link rel="stylesheet" href="https://js.arcgis.com/3.46/dijit/themes/claro/claro.css">
  <link rel="stylesheet" href="https://js.arcgis.com/3.46/esri/css/esri.css">
  <script src="https://js.arcgis.com/3.46/"></script>

  <style>
    html, body, #map{
      width:100%;
      height:100%;
      margin:0;
      padding:0;
    }
  </style>

 <script>
    require([
      "esri/layers/FeatureLayer",
      "esri/dijit/FeatureTable",
      "esri/tasks/query",
      "esri/geometry/Extent",
      "esri/symbols/SimpleFillSymbol",
      "esri/symbols/SimpleLineSymbol",
      "esri/Color",
      "esri/map",
      "esri/dijit/Popup",
      "esri/dijit/PopupTemplate",
      "dojo/dom-construct",
      "dojo/dom",
      "dojo/number",
      "dojo/parser",
      "dojo/ready",
      "dojo/on",
      "dojo/_base/lang",
      "dijit/registry",
      "dijit/form/Button",
      "dijit/layout/ContentPane",
      "dijit/layout/BorderContainer",
      "dijit/form/TextBox"
    ], function (
      FeatureLayer, FeatureTable, Query, Extent, SimpleFillSymbol, SimpleLineSymbol, Color, Map,
      Popup, PopupTemplate, domConstruct, dom, dojoNum, parser, ready, on,lang,
      registry, Button, ContentPane, BorderContainer, TextBox
    ) {

      parser.parse();

      ready(function(){
        var popupOptions = {
          marginLeft: "20",
          marginTop: "20"
        };

        // create a popup to replace the map's info window
        var popup = new Popup(popupOptions, domConstruct.create("div"));

        var map = new Map("map",{
          basemap: "topo-vector",
          infoWindow: popup,
          extent: new Extent({
            xmax: -13178092.546668783, xmin: -13180901.607458338,
            ymax: 4038066.907666304,  ymin: 4036294.524072895,
            "spatialReference":{"wkid":102100,"latestWkid":3857}
          })
        });

        map.on("load", loadTable);

        function loadTable(){

          // create a popup template for Bevery Hills
          // Trees by block layer
          var popupTemplate = new PopupTemplate({
            "title": "Beverly Hills Trees By Block",
            "fieldInfos": [{
              "fieldName": "Point_Count",
              "label": "Count of Points",
              "format": {
                "places": 0,
                "digitSeparator": true
              }
            }, {
              "fieldName": "relationships/0/Point_Count_COMMON",
              "label": "Sum of species tree count",
              "format": {
                "places": 0,
                "digitSeparator": true
              },
              "statisticType": "sum"
            }, {
              "fieldName": "relationships/0/COMMON",
              "label": "Common Name"
            }, {
              "fieldName": "BLOCKCE10",
              "label": "Block"
            }],
            "description": "There are {Point_Count} trees within census block {BLOCKCE10}",
            "showAttachments": false,
            "mediaInfos": [{
              "title": "Count By Type",
              "type": "columnchart",
              "caption": "",
              "value": {
                "theme": "GreySkies",
                "fields": ["relationships/0/Point_Count_COMMON"],
                "normalizeField": null,
                "tooltipField": "relationships/0/COMMON"
              }
            }]
          });

          var myFeatureLayer = new FeatureLayer("https://services.arcgis.com/V6ZHFr6zdgNZuVG0/ArcGIS/rest/services/Beverly%20Hills%20Trees%20By%20Block/FeatureServer/0",{
            mode: FeatureLayer.MODE_ONDEMAND,
            infoTemplate: popupTemplate,
            outFields: ["*"],
            //set the definition expression
            definitionExpression: "TRACTCE10 = '700902'",
            visible: true,
            id: "fLayer"
          });

           // apply the selection symbol for the layer
          var selectionSymbol = new SimpleFillSymbol(SimpleFillSymbol.STYLE_SOLID,
            new SimpleLineSymbol(SimpleLineSymbol.STYLE_SOLID,
              new Color([255, 0, 0, 0.35]), 1),
            new Color([255, 0, 0, 0.35]));
          myFeatureLayer.setSelectionSymbol(selectionSymbol);


          // listen to featurelayer click event to handle selection
          // from layer to the table.
          // when user clicks on a feature on the map, the corresponding
          // record will be selected in the table.
          myFeatureLayer.on("click", function(evt) {
           var idProperty = myFeatureLayer.objectIdField;
           var feature, featureId, query;

           if (evt.graphic && evt.graphic.attributes && evt.graphic.attributes[idProperty]) {
               feature = evt.graphic,
               featureId = feature.attributes[idProperty];

               query = new Query();
               query.returnGeometry = false;
               query.objectIds = [featureId];
               query.where = "1=1";

               myFeatureLayer.selectFeatures(query, FeatureLayer.SELECTION_NEW);
           }
         });

          map.addLayer(myFeatureLayer);

          // create new FeatureTable and set its properties
          var myFeatureTable = new FeatureTable({
            featureLayer : myFeatureLayer,
            map : map,
            syncSelection: true,
            showRelatedRecords: true,
            showAttachments: true,
            fieldInfos: [
              {
                name: 'AnalysisArea',
                alias: 'Area SQ/KM',
                editable: false,
                format: {
                  template: "${value}",
                  places: 3 // number of decimal places
                  // digitSeparator: true // default is true
                }
              }
            ],
            // outfields
            outFields: ["TRACTCE10", "BLOCKCE10", "GEOID", "NAME", "MTFCC", "ALAND", "AnalysisArea", "Point_Count", "Join_ID"],
          }, 'myTableNode');

          myFeatureTable.startup();

          // listen to row-click event
          // to hide visible popups
          myFeatureTable.on("row-select", function(evt){
            if (map.infoWindow.isShowing){
              map.infoWindow.hide();
            }
          });

          // listen to show-attachments event
          myFeatureTable.on("show-attachments", function(evt){
            console.log("show-attachments event - ", evt);
          });

          // listen to show-related-records event
          myFeatureTable.on("show-related-records", function(evt){
            console.log("show-related-records event - ", evt);
          });
        }
      });
    });
  </script>
</head>

<body class="claro esri">
  <div data-dojo-type="dijit/layout/BorderContainer" data-dojo-props="design:'headline'" style="width:100%; height:100%;">
    <div data-dojo-type="dijit/layout/ContentPane" data-dojo-props="region:'center', splitter:true" style="height:60%">
      <div id="map"></div>
    </div>
    <div id="bot" data-dojo-type="dijit/layout/ContentPane" data-dojo-props="region:'bottom', splitter:true" style="height:40%">
      <div id="myTableNode"></div>
    </div>
  </div>
</body>
</html>