 Hide Table of Contents
 Analysis
 Dynamic Layers
 Editing
 Feature Layers
 Feature Table
 Graphics
 Map
Map
 Mobile
 Online and Portal
 Popups and Info Windows
 Query and Select
 Renderers, Symbols, Visualization
 Search

Select with Feature Layer
Explore in the sandbox
Open in CodePen
View live sample
Description
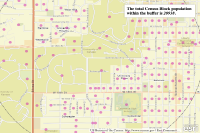
Click the map to generate a buffer of one mile around the point clicked. The circle is generated client side and is then used to query points that represent census blocks in the buffered area. Click on a point to see more information about the census block.
Code
<!DOCTYPE html>
<html>
  <head>
    <meta http-equiv="Content-Type" content="text/html; charset=utf-8">

    <meta name="viewport" content="initial-scale=1, maximum-scale=1,user-scalable=no">
    <title>Select with feature layer</title>
    <link rel="stylesheet" href="https://js.arcgis.com/3.46/dijit/themes/tundra/tundra.css">
    <link rel="stylesheet" href="https://js.arcgis.com/3.46/esri/css/esri.css">
    <style>
      html, body, #mapDiv {
        padding: 0;
        margin: 0;
        height: 100%;
      }
      #messages{
        background-color: #fff;
        box-shadow: 0 0 5px #888;
        font-size: 1.1em;
        max-width: 15em;
        padding: 0.5em;
        position: absolute;
        right: 20px;
        top: 20px;
        z-index: 40;
      }
    </style>
    <script src="https://js.arcgis.com/3.46/"></script>
    <script>
      var map;
      require([
        "esri/map", "esri/layers/FeatureLayer",
        "esri/tasks/query", "esri/geometry/Circle",
        "esri/graphic", "esri/symbols/SimpleMarkerSymbol",
        "esri/symbols/SimpleLineSymbol", "esri/symbols/SimpleFillSymbol", "esri/renderers/SimpleRenderer",
        "esri/config", "esri/Color", "dojo/dom", "dojo/domReady!"
      ], function(
        Map, FeatureLayer,
        Query, Circle,
        Graphic, SimpleMarkerSymbol,
        SimpleLineSymbol, SimpleFillSymbol, SimpleRenderer,
        esriConfig, Color, dom
      ) {

        map = new Map("mapDiv", {
          basemap: "streets-vector",
          center: [-95.249, 38.954],
          zoom: 14,
          slider: false
        });

        // Add the census block points in on demand mode. An outfield is specified since it is used when calculating   the total population falling within the one mile radius.
        var featureLayer = new FeatureLayer("https://sampleserver6.arcgisonline.com/arcgis/rest/services/Census/MapServer/0",{
          outFields: ["POP2000"]
        });

        // Selection symbol used to draw the selected census block points within the buffer polygon
        var symbol = new SimpleMarkerSymbol(
          SimpleMarkerSymbol.STYLE_CIRCLE,
          12,
          new SimpleLineSymbol(
            SimpleLineSymbol.STYLE_NULL,
            new Color([247, 34, 101, 0.9]),
            1
          ),
          new Color([207, 34, 171, 0.5])
        );
        featureLayer.setSelectionSymbol(symbol);

        // Make unselected features invisible
        var nullSymbol = new SimpleMarkerSymbol().setSize(0);
        featureLayer.setRenderer(new SimpleRenderer(nullSymbol));

        map.addLayer(featureLayer);

        var circleSymb = new SimpleFillSymbol(
          SimpleFillSymbol.STYLE_NULL,
          new SimpleLineSymbol(
            SimpleLineSymbol.STYLE_SHORTDASHDOTDOT,
            new Color([105, 105, 105]),
            2
          ), new Color([255, 255, 0, 0.25])
        );
        var circle;

        // When the map is clicked create a buffer around the click point of the specified distance
        map.on("click", function(evt){
          circle = new Circle({
            center: evt.mapPoint,
            geodesic: true,
            radius: 1,
            radiusUnit: "esriMiles"
          });
          map.graphics.clear();
          var graphic = new Graphic(circle, circleSymb);
          map.graphics.add(graphic);

          var query = new Query();
          query.geometry = circle.getExtent();
          // Use a fast bounding box query. It will only go to the server if bounding box is outside of the visible map.
          featureLayer.queryFeatures(query, selectInBuffer);
        });

        function selectInBuffer(response){
          var feature;
          var features = response.features;
          var inBuffer = [];
          // Filter out features that are not actually in buffer, since we got all points in the buffer's bounding box
          for (var i = 0; i < features.length; i++) {
            feature = features[i];
            if(circle.contains(feature.geometry)){
              inBuffer.push(feature.attributes[featureLayer.objectIdField]);
            }
          }
          var query = new Query();
          query.objectIds = inBuffer;
          // Use an objectIds selection query (should not need to go to the server)
          featureLayer.selectFeatures(query, FeatureLayer.SELECTION_NEW, function(results){
            var totalPopulation = sumPopulation(results);
            var r = "";
            r = "<b>The total Census Block population within the buffer is <i>" + totalPopulation + "</i>.</b>";
            dom.byId("messages").innerHTML = r;
          });
        }

        function sumPopulation(features) {
          var popTotal = 0;
          for (var x = 0; x < features.length; x++) {
            popTotal = popTotal + features[x].attributes["POP2000"];
          }
          return popTotal;
        }
      });
    </script>
  </head>

  <body>
    <span id="messages">Click on the map to select census block points within 1 mile.</span>
    <div id="mapDiv"></div>
  </body>
</html>