 Hide Table of Contents
 Analysis
 Dynamic Layers
 Editing
 Feature Layers
 Feature Table
 Graphics
 Map
Map
 Mobile
 Online and Portal
 Popups and Info Windows
 Query and Select
 Renderers, Symbols, Visualization
 Search

Explore in the sandbox
Open in CodePen
View live sample
Description
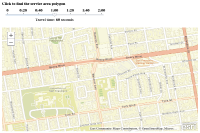
This sample demonstrates how to work with ServiceAreaTask added at version 2.0. This sample uses the task to calculate the service area around an input location. A network service area is a region that encompasses all accessible streets within the specified range. The ServiceAreaParameters object is used to define the parameters used to calculate the service area. In the snippet below the defaultBreaks property is used to define that a two minute drive time service area should be calculated.
params = new esri.tasks.ServiceAreaParameters(); params.defaultBreaks= [2]; params.outSpatialReference = map.spatialReference; params.returnFacilities = false;
The input location is defined by creating a new facility when a user clicks on the map. Once the facility is generated a new service area request is created and sent to the server. After the route is solved, the results are returned to the client and the result is added to the map's graphics layer.
Code
<!DOCTYPE html>
<html>
<head>
  <meta http-equiv="Content-Type" content="text/html; charset=utf-8">

  <meta name="viewport" content="initial-scale=1, maximum-scale=1,user-scalable=no">
  <title>Basic Service Area</title>

  <link rel="stylesheet" href="https://js.arcgis.com/3.46/dijit/themes/claro/claro.css">
  <link rel="stylesheet" href="https://js.arcgis.com/3.46/esri/css/esri.css">
  <style>
    body, html, #main {
      margin: 0;
      padding: 0;
      height: 100%;
      width: 100%;
    }
  </style>

  <script src="https://js.arcgis.com/3.46/"></script>
  <script>
    var map, serviceAreaTask, params, clickpoint;

    require([
      "esri/map",
      "esri/tasks/ServiceAreaTask", "esri/tasks/ServiceAreaParameters", "esri/tasks/FeatureSet",
      "esri/symbols/SimpleMarkerSymbol", "esri/symbols/SimpleLineSymbol", "esri/symbols/SimpleFillSymbol",
      "esri/geometry/Point", "esri/graphic",
      "dojo/parser", "dojo/dom", "dijit/registry",
      "esri/Color", "dojo/_base/array",
      "dijit/layout/BorderContainer", "dijit/layout/ContentPane",
      "dijit/form/HorizontalRule", "dijit/form/HorizontalRuleLabels", "dijit/form/HorizontalSlider",
      "dojo/domReady!"
    ], function(
      Map,
      ServiceAreaTask, ServiceAreaParameters, FeatureSet,
      SimpleMarkerSymbol, SimpleLineSymbol, SimpleFillSymbol,
      Point, Graphic,
      parser, dom, registry,
      Color, arrayUtils
    ) {
      parser.parse();

      map = new Map("map", {
        basemap: "streets-vector",
        center: [-117.16, 32.71],
        zoom: 15
      });

      map.on("click", mapClickHandler);

      params = new ServiceAreaParameters();
      params.defaultBreaks= [1];
      params.outSpatialReference = map.spatialReference;
      params.returnFacilities = false;

      serviceAreaTask = new ServiceAreaTask("https://sampleserver6.arcgisonline.com/arcgis/rest/services/NetworkAnalysis/SanDiego/NAServer/ServiceArea");

      registry.byId("hslider").on("change", updateHorizontalLabel);
      updateHorizontalLabel();

      // Create function that updates label when changed
      function updateHorizontalLabel() {
        // Get access to nodes/widgets we need to get/set values
        var hSlider = registry.byId("hslider");
        var label = dom.byId("decValue");
        // Update label
        label.innerHTML = hSlider.get("value");
        params.defaultBreaks = [ hSlider.value / 60 ];
        if (clickpoint) {
          mapClickHandler(clickpoint);
        }
      }

      function mapClickHandler(evt) {
        clickpoint = evt;
        map.graphics.clear(); //clear existing graphics
        //define the symbology used to display the results and input point
        var pointSymbol = new SimpleMarkerSymbol(
          "diamond",
          20,
          new SimpleLineSymbol(
            "solid",
            new Color([88,116,152]), 2
          ),
          new Color([88,116,152,0.45])
        );
        var inPoint = new Point(evt.mapPoint.x, evt.mapPoint.y, map.spatialReference);
        var location = new Graphic(inPoint, pointSymbol);

        map.graphics.add(location);
        var features = [];
        features.push(location);
        var facilities = new FeatureSet();
        facilities.features = features;
        params.facilities = facilities;

        //solve
        serviceAreaTask.solve(params,function(solveResult){
          var polygonSymbol = new SimpleFillSymbol(
            "solid",
            new SimpleLineSymbol("solid", new Color([232,104,80]), 2),
            new Color([232,104,80,0.25])
          );
          arrayUtils.forEach(solveResult.serviceAreaPolygons, function(serviceArea){
            serviceArea.setSymbol(polygonSymbol);
            map.graphics.add(serviceArea);
          });

        }, function(err){
          console.log(err.message);
        });
      }
    });
  </script>
</head>

<body class="claro">
  <div data-dojo-type="dijit/layout/BorderContainer" data-dojo-props="design:'headline', gutters:false" style="width:100%;height:100%;margin:0px;">
    <div data-dojo-type="dijit/layout/ContentPane" data-dojo-props="region:'top'">
      <b>Click to find the service area polygon</b>

      <div style="width: 400px; margin: 10px">

        <ol data-dojo-type="dijit/form/HorizontalRuleLabels"
          data-dojo-props="
            container: 'topDecoration',
            style: 'height: 1.2em; font-weight: bold; margin: 0 12px;'">
          <li>0</li>
          <li>0:20</li>
          <li>0:40</li>
          <li>1:00</li>
          <li>1:20</li>
          <li>1:40</li>
          <li>2:00</li>
        </ol>
        <div data-dojo-type="dijit/form/HorizontalRule"
          data-dojo-props="
            container: 'topDecoration',
            count: 7,
            style: 'height: 5px; margin: 0 12px;'">
        </div>
        <input id="hslider" value="60" type="range"
          data-dojo-type="dijit/form/HorizontalSlider"
          data-dojo-props="
            minimum: 0,
            maximum: 120,
            showButtons: false,
            discreteValues: 25">
        <div style="padding-top: 10px; text-align: center;">Travel time: <strong id="decValue"></strong> seconds</div>
      </div>

    </div>

    <div id="map" dojotype="dijit/layout/ContentPane" data-dojo-props="region:'center'"></div>
  </div>
</body>
</html>