 Hide Table of Contents
 Analysis
 Dynamic Layers
 Editing
 Feature Layers
 Feature Table
 Graphics
 Map
Map
 Mobile
 Online and Portal
 Popups and Info Windows
 Query and Select
 Renderers, Symbols, Visualization
 Search

Explore in the sandbox
Open in CodePen
View live sample
Description
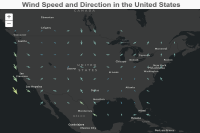
This sample demonstrates how to create an ArcGISImageServiceVectorLayer using an image service.
The image service used in this application contains weather data from the National Digital Forecast Database (NDFD) of the National Weather Service. In particular it contains wind speed and wind direction variables which can be visualized using vector symbology. This is done by using theVectorFieldRenderer.
You can set the properties in the renderer, to depict multivariate data, such as wind speed and direction. This sample uses the sizeInfo and rotationInfo properties to accomplish this. You can further illustrate data variables using opacityInfo and colorInfo.
The data is managed using a multidimensional mosaic dataset with a vector field processing template that computes thedirections and sizes of the vector symbols on the fly. Esri reserves the right to change or remove this service at any time and without notice.
Code
<!DOCTYPE html>
<html>
<head>
<meta http-equiv="Content-Type" content="text/html; charset=utf-8">
<meta name="viewport" content="initial-scale=1,maximum-scale=1,user-scalable=no">
<title>Image Service Vector Layer</title>
<link rel="stylesheet" href="https://js.arcgis.com/3.46/dijit/themes/claro/claro.css">
<link rel="stylesheet" href="https://js.arcgis.com/3.46/esri/css/esri.css">
<style>
  html, body, #map {
    width: 100%;
    height: 100%;
    margin: 0;
    padding: 0;
  }
  #header
  {
    height: 30px;
    padding: 5px;
    width: 100%;
    text-align: center;
    vertical-align: middle;
    background-color:#f9f9f9;
    color:#666666;
    font-family:arial;
    font-size:1.8em;
    font-weight:bold;
  }
</style>

<script src="https://js.arcgis.com/3.46/"></script>
<script>
  require([
    "esri/map",
    "esri/Color",
    "esri/layers/ArcGISImageServiceVectorLayer",
    "esri/renderers/VectorFieldRenderer",
    "esri/geometry/Extent",
    "esri/SpatialReference",
    "dojo/domReady!"
  ], function(
    Map, Color,
    ArcGISImageServiceVectorLayer, VectorFieldRenderer,
    Extent, SpatialReference)
  {
    var url = "https://sampleserver6.arcgisonline.com/arcgis/rest/services/ScientificData/NDFD_wind/ImageServer";
    var dataExtent = new Extent(-130, 20, -60, 52, new SpatialReference(4326));

    var map = new Map("map", {
      basemap: "dark-gray-vector",
      extent: dataExtent
    });

    //Create the ArcGISImageServiceVectorLayer
    var vectorLayer = new ArcGISImageServiceVectorLayer(url, {
      rendererStyle: VectorFieldRenderer.STYLE_CLASSIFIED_ARROW
    });

    //Set the size of the arrows based on wind speed
    var sizeInfoVar = {
      type: "sizeInfo",
      minSize: 3,
      maxSize: 100,
      minDataValue: 0.04,
      maxDataValue: 32
    };
    var renderer = new VectorFieldRenderer({
      style: VectorFieldRenderer.STYLE_BEAUFORT_KN,
      flowRepresentation: VectorFieldRenderer.FLOW_TO
    });
    //Apply the size settings to the renderer
    renderer.setVisualVariables([sizeInfoVar]);
    vectorLayer.setRenderer(renderer);
    //Add the layer to the map
    map.addLayer(vectorLayer);
  });
</script>
</head>

<body>
<div id="header">Wind Speed and Direction in the United States</div>
<div id="map"></div>
</body>

</html>